

turboplanner
-
Posts
24,363 -
Joined
-
Last visited
-
Days Won
159
Content Type
Profiles
Forums
Gallery
Downloads
Blogs
Events
Store
Aircraft
Resources
Tutorials
Articles
Classifieds
Movies
Books
Community Map
Quizzes
Videos Directory
Posts posted by turboplanner
-
-
Renewable energy goes hand in hand with the Climate change issue raised by the 5 ex commissioners which has now swelled to 23 people.
Country people have replaced the old 32volt Lister diesel generators where, when you turned a light switch on you could hear the engine start up, and it would shut down when the last switch was turned off.
There were no transmission fires from this system, but it was followed by networks of power lines across the paddocks and along the roads, and when the wind farms were built more power grid lines were built, and we’ve had the advent of a significant number of fires caused by failures in poles and contact by trees, the Ash Wednesday fires at Macedon being the most serious.
The best solution would be to generate power to country homes at the home site, and while some people manage to live totally on solar, we don’t yet have the economics and technology to do this on a large farm.
In certain types of farming power supply is absolutely critical – incubation etc.
Probably the dirtiest thing about our power supply today is the number of misleading stories that are told in this industry.
Base Load Power
Generators driven by steam turbines require boilers running at high temperatures.
If the boilers are shut down when power demand drops, the rapid changes in temperature damage them, so these Power Stations are required to run 24/7 at a rate of generation which will not damage the boilers.
This is known as Base Load Power and historically, cheap rates (“Off Peak”) were offered for refrigerators, hot water systems etc to cover the cost of running the power plants at base load.
In recent times some renewable energy suppliers have been referring to Base Load Power as a baseline of consumer demand.
By quoting this fake Base Load Power, unsurprisingly their system outputs running flat out are not dissimilar to those of coal/gas/oil fired Power plants – close enough to fool members of the public that they are the way of the future, and we should get rid of Coal-fired plants now!
However, we don’t demand maximum power during cool autumn nights when everyone is asleep, we demand it in the summer-time to power air conditioning, and that’s called Peak Power, and that’s what counts.
When the fuel fired Plants come up to speed we demand a HUGE increase in power generation.
Even after 30 years of us paying subsidies from our taxes, wind and solar power don’t have a snowball’s chance in hell of meeting this Peak Power requirement.
Do we have any proof of this? Yes, we do. I would recommend everyone copy and paste this link somewhere safe and bring it out this summer when we start to hit Peak Power Demand, and blackouts start rolling through, and you’ll be able to see for yourself.
This is the link to the Australian Energy Market Operator Data Dashboard
Electricity can be shunted around the eastern grid from Sugar Mills in Queensland to News South Wales to Victoria to the hydro system in Tasmania to South Australia in any direction needed.
The darker rectangles in the Data Dashboard show power flow live in Megawatts (MW) for:
· Demand
· Generation
· Generation Wind and Other
They also show the going price per Megawatt per hour MWh)
The small moving arrows (triangles) show power being transferred from one state to another to fill Peak Power Demand anywhere on the grid.
If we freeze the Dashboard in a non-peak day and time (8:51, 18/11/19),
we can calculate the contribution of Wind and Other generation in each State.
Demand
Fuel-fired Generation
(Coal/Gas/Oil/Bagasse)
Wind/Solar Generation
W/S % of Demand
Qld
6165
5626
1063
17.2%
NSW
7536
6320
956
12.7%
Vic
4747
3676
586
12.3%
Tas
1160
1260
161
13.9%
SA
1147
798
311
27.1%
Looking at the percentage performance of Wind and Solar Plants, you could be forgiven for believing the “Renewable” stories about their performance being competitive.
However, when Peak Power is required they are a disaster.
Last summer, on the day power was disconnected from over 100,000 homes in Victoria to save the power grid the Wind and Solar generation was about the same as the above chart.
As I recall, Queensland and NSW were on about 1300 MW each.
However, the available coal-fired plants had kicked in with South Australia drawing power from Victoria, Victoria drawing power from Tasmania and NSW and NSW drawing power from Queensland.
Where the Wind/Solar generation was reading about 1300 MW, the Coal-Fired Power churned out was about 130,000 MW
After 30 years of subsidies Wind Farms and Solar Energy could only supply about 1% of our needs, and it was in that 1% bracket for every State on that day.
The best spin you could put on that hopeless performance was that the governments are subsidising the wind farms who are giving part of that money to graziers trying to survive on wool.
With this link, on a hot day you can look at the Dashboard and ask yourself why you’ve been paying taxes to prop up an industry for 30 years that can only make 1% of Peak Demand.
Maybe some of you can contact your State governments and ask for a tax refund based on non-performance.
If the 23 dudes get under Canberra’s skin and the government decides to “do something” about climate change, remember that the political solution might be more subsidies for the renewables.
-
 1
1
-
 1
1
-
-
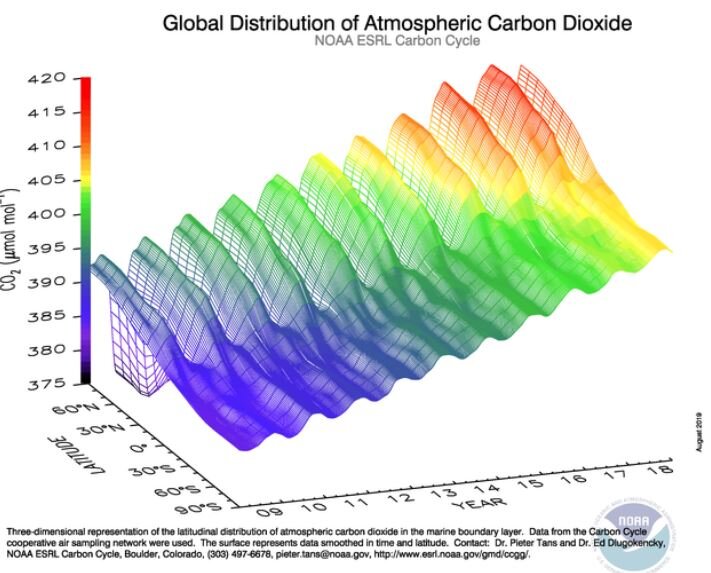
"I'm very intrigued that no one has commented on the complex graph I posted in #143. - the Global Distribution of Atmospheric CO2."
Octave: "I am not sure what conclusion you are drawing from this so perhaps you could explain it."
Simple:
You'll remember when the Ozone layer was a problem it had holes at the poles.
This graph shows, by latitude, where all the CO2 is sitting above the earth.
Most CO2 is sitting up in the northern hemisphere above the highly populated countries.
There is very little CO2 in the Southern Hemisphere, and if you compare the capital city latitudes I posted earlier most of Australia has only a tiny amount, and Hobart from memory is off the bottom of the graph.
The conclusion this graph leads to is if CO2 is a global warming cause and not a global warming by-product#, then it's a Northern Hemisphere problem for the northern Hemisphere to fix. (Historically, during the cold war period, Nuclear fallout was also going to stay in the Northern Hemisphere, due to the world's weather patterns).
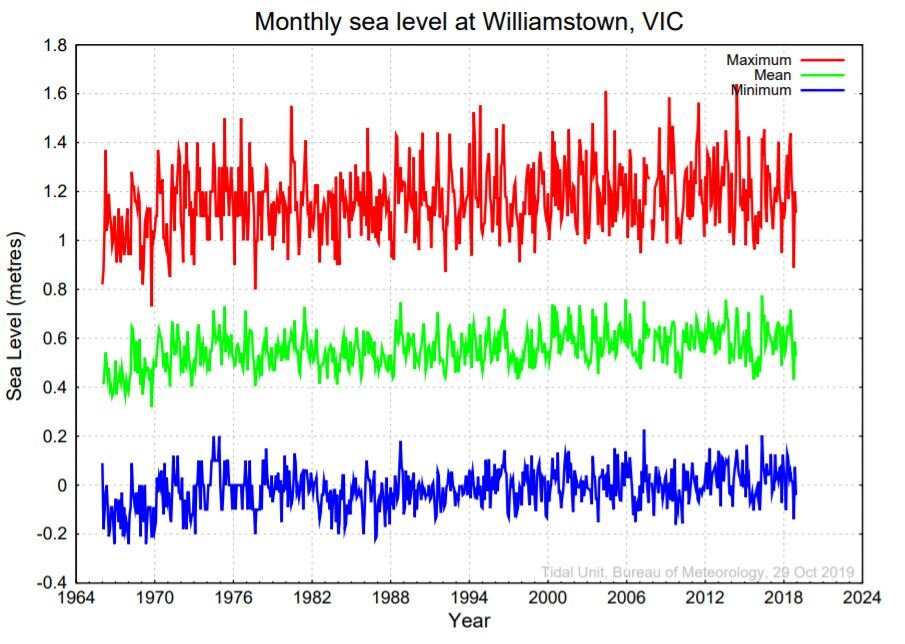
Based on this graph, it's therefore not surprising that the Williamstown Tiday Gauge is not indicating Global Warming.
# In the morphing of the theories of climate scientists from "Greenhouse Gases" to "Global Warming" to "Climate Change" (downward descriptions by the way), CO2 was not mentioned as a cause in the early days.

-
You seem to be asserting that the measurements from one gauge indicative of global sea rise and yet the radar altimetry measurements from NASAs Jasan satellites show a clear rise https://www.aviso.altimetry.fr/en/data/products/ocean-indicators-products/mean-sea-level/products-images.html
If you believe the the Willytwn measurements are relevant by themselves then why not Darwin's measurements by themselves they show a steady increase.
Do you believe the radar altimetry is inaccurate and why do you believe that. Does it contradict measurements from other satellite? if so which ones?
I am not sure what conclusion you are drawing from this so perhaps you could explain it.
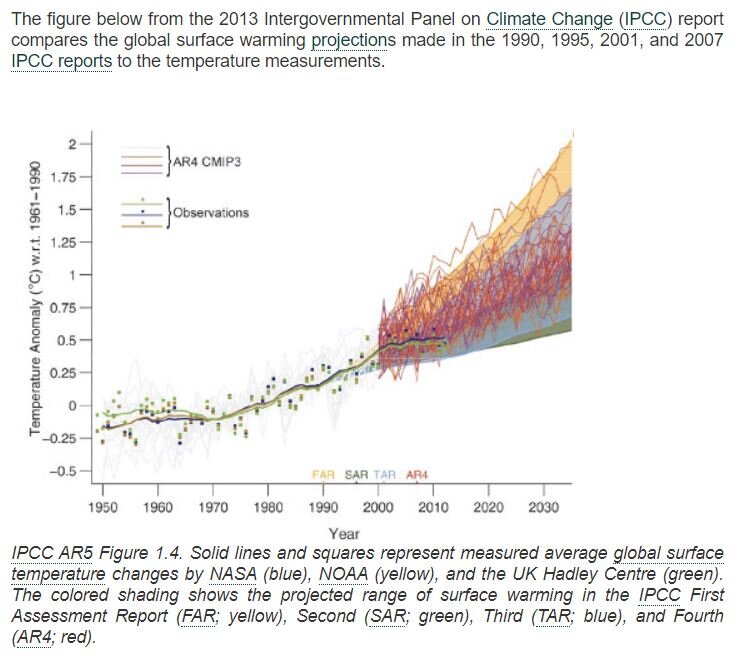
The IPCC graph shows predictions of global warming; if the temperature goes all the water in all the seas expands and sea level rises in correlation.
Yes I know the IPCC is for air temp and I'm going to use a sea level comparison, but this is just a quick comparison for a forum, where you can do your own research if you wish.
The IPCC and sea level graphs of GW predictions both have a very flat history, then a sharp exponential uplift from the start of the Industrial age; that's been the message repeated over and over again. If you look at the period from 1964 to the present any graph should have a distinct upward tilt.
If you then go to the Williamstown Tidal Gauge data, which is accurate water level height measured at exactly the same location time after time for 54 years from 1964 to 2018, when we are well into that upward curve where the sea should be starting to invade and species should be starting to die, you don't see that 20 - 30 degree upward trend, it's more or less flat. An upward trend would have higher highs and higher lows, but at Williamstown that hasn't happened.
Yes it is just one place
No, I'm not saying individual tidal gauges elsewhere will be the same as Williamstown, but this should certainly spark research.
You could check the Darwin tidal gauge, and that might well have different figures or trend.
I'm not saying satellites are inaccurate, although I have found remarkable differences between surveyed heights and satellite heights on land.
I am saying that the tidal gauge at Williamstown does not reflect the prediction of people who have taken ocean temperatures from around the world, and then combined them and used their own assumptions and methodology to massage them into a single figure such as 1 mm or 3 mm for the whole world.
What I am saying is that Melbourne, which officially uses this Tidal Gauge for its Planning AHD heights could, if it obtained the correlating Chart for seal level rise predictions, make its own mind up from its own data that it is (a) about to be flooded by global warming or (b) has not been affected by any warming, and based on the unadulterated factual data, is not likely to be any time soon.
-
I've looked at this; we have to get back to fire fighting, but he's putting forward a case with the benefit of hindsight, or if you like reverse engineering.
I could apply the same theme to Pearl Harbour in WW2.
or, how is the Steam Engine going?
I'm very conscious that there is a list out there on the internet of famous quotes by well known people that "such and such" could never be done, and the inventions and developments run to hundreds, but that's just statistics.
The failures of people who follow in the footsteps of your disruptive technologies numbers in the millions.
-
- Battery tech
- Smart grids
- Hydrogen creation & transport
- Algae
- Carbon fibre from black coal
- Plastic extraction from the ocean
- Recycling
- Biofuels
- Education & research
- Electric vehicles
And that's just off the top of my head in the last 30 seconds. There would be literally hundreds of industries that Australia could be world leaders in, if the government actually a) acknowledged the urgency, b) acknowledged that even if we meet Kyoto/Paris it's not nearly enough, and c) showed some leadership and certainty to industry by placing the true costs of emissions back on the industries which do it.
I could produce the same sort of list; in fact we could list hundreds of thousands of products but you haven't addressed what I said "To stay in business you have to sell something."
There are literally dozens of "Technology Parks" ect around Australia, mostly occupied by conventional businesses, because "hi tech" ones couldn't be found. Hi Tech by the way was a buzz word of the young executive in the late 1960s.
Good luck with your Hi Tech renewables; I hope you succeed.
- Battery tech
-
It is amazing how the FUDs (this is what we call them now) seem to believe that they live at the pinnacle of human technological development. Ignoring the change in technology throughout their lifespan thus far they suddenly believe that the only sound investment is in today's technology or perhaps even yesterdays.
This discussion needs to get back to Fire fighting strategy, and in particular the use of aircraft. Unfortunately I need to contribute a detailed set of information on something else in order to get there, but for this gem:
The peaks in the investment world are fear and greed. The FUDs live in the fear side, but you conveniently left out the greed side.
-
 1
1
-
-
Why can't the manufacturing jobs be in high-tech renewables creation, using solar farms and battery for power?
To stay in business you have to sell something.
high-tech renewables are like those 1930s widgets; everyone talked about them but there weren't too many widgets sitting on counters.
-
And meanwhile we destroy manufacturing in this country by having the highest power prices in the world. Smugness has its price but we live in a competitive world and should not, as a small nation, put ourselves in an un-competitive position just to feel good about ourselves. Very few industrial nations met their Kyoto target and I suspect that not many will met the Paris goals but the politicians of all nations will be saying one thing whilst doing another, whilst we in Australia pat ourselves on the back by telling ourselves what good little vegemites we are and wondering where the jobs that sustain the nation are.
If the original global warming predictions are true, and the faithful ared still well and truly on message, we are past the easy road and facing the temperature runaway period, so will have to bite the bullet and live to mid 1800's poverty standards. We certainly will have to be focusing on extracting every minute cent out of the things we will do. However, we've been missing predicted disasters, so it's not quite set in stone yet.
I'm very intrigued that no one has commented on the complex graph I posted in #143. - the Global Distribution of Atmospherice CO2.
This appears to be a bombshell in some respects. It looks like CO2 induced events are being caused by the northern Hemisphere only, with Australian latitudes emitting very little CO2 at all. I'd be very interested in people's comments and analysis of this graph.
The other bombshell, to me, was finding that the Williamstown Tidal Gauge recent history is not indicating sea level rise.
-
Sorry Turbs, I thought my position was plain enough: that the increased concentration of CO2 (and several other gases we release into our atmosphere) are contributing to the changes in climate that we see.
I also accept that not all evidence supports this conclusion, but the time is long past when our species can afford to put off cleaning up its act.
There's no need for an apology; I was just curious, asked the question you answered, pointed me in the right direction for some research. Where old mate is floating I don't know.
-
.....cat; just like my wife.........
-
Definition. Theories are formulated to explain, predict, and understand phenomena and, in many cases, to challenge and extend existing knowledge within the limits of critical bounding assumptions.
Definition of hypothesis: A supposition or proposed explanation made on the basis of limited evidence as a starting point for further investigation.
Definition of scientific fact: In the most basic sense, a scientific fact is an objective and verifiable observation, in contrast with a hypothesis or theory, which is intended to explain or interpret facts. (From a NASA fact sheet on CO2 in the atmosphere.)
Scientific evidence of action of CO2 in causing warming of the climate system is unequivocal. The heat-trapping nature of carbon dioxide and other gases was demonstrated in the mid-19th century.
Burning (oxidation) of hydro carbon fuel produces heat, water vapour and CO2
How many ways do you guys need to have this explained to you before 'the penny drops"?
As I mentioned to you before, I was asking OK his opinion on CO2; nothing more nothing less; if you want to go off into your world that's fine; just don't attach it to my conversation, which OK hadn't answered.
-
......teeth out, and..
-
...television set or....
-
No, I'm not. But that has nothing to do with thinking its a good result that someone is in ICU.
Ah, I see; I don’t think he was talking about the patient but us peer group recognising what he did and showing recognition.
-
“......taking advice from that Sergeant dude that keeps crawling in here?”
”He’s a Captain” said his Secretary, and he laughed and said “Well we’re not going to take a chance on those clowns influencing Canberra; Call Don and tell him to send a drone to take out their Kombi, and I’ll refuse entry to Nancy Pelosi for him. “But she’s not coming to Australia” the Secretary said. “She will when I contact her.....”
-
Good result? Regardless of anything else that seems a tad harsh. The man is seriously injured and in ICU. Not something I would wish on anyone.
You’re happy with someone flying around the town at power line height? How would you feel about him if he’d hit a house and killed some of your family?
-
Well I now have the definitive answer to why we have the existing drought and all the bushfires. According to Israel Folau in his latest rant it is God's punishment for legalising same sex marriage and abortion. So there you have it, a simple answer to a complex issue that will have all the god botherers nodding their heads.
I think poor Israel has his radio tuned to the wrong station. Sad case.
-
1
-
-
....resulted in a fights over whether it was possible to land a Jabiru on the lawns beside the Swannee River, or......
-
..some of them even thoughtg about getting out of bed in the morning like people from the East do, and Tasmanians say Mainlanders do, not knowing that in the sunset country manana lasts until the pubs open and......
-
.....the South Bali tellers; ANYTHING to get out of here and across east to civilisation, where the customers wear shoes.
"Even the Bank of Western Australia has ditched its name and now calls itself BankWest" said the Westbank CEO; "why don't we move to Melbourne and call ourselves Eastpac!"
And he was made Chairman and given a six million dollar bonus for such a great idea, and then he decided to take up flying.
-
We've seen that sea level rise can be quite different in different parts of the world and different parts of Australia based on accurate tidal gauge readings and that Global Mean sea level is a derived level based on the Climate Scientists input parameters, so not necessarily related to a particular geographic place.
One of the reasons I posted historic climate discussions is to show that CO2 was not being discussed in early global warming meetings (not that there is anything wrong with that)
We've seen that Australia has not yet regulated for levels of CO2 output for cars, and that there are difficulties because the quality of fuel determines the output.
The first measurements of atmospheric CO2 in the world were by Dave Keating at Caltech in the 1950s, and he started ongoing measurements at Mauna Loa, Hawaii in 1958.
This graph by the US National Oceanic & Atmosphere Administration (NOAA) shows the distribution of CO2 in the earth's atmosphere.
It shows seasonal fluctuations and the difference between northern and southern hemispheres.
This could become very important for long term fire fighting decisions.
To see where Australia fits into this, approximate latitudes are:
Tip of Cape York: 11 degrees South
Brisbane: 27
Perth: 31
Sydney: 34
Adelaide: 35
Melbourne: 38
Hobart: 43
-
Refer to my post #80 and don't backtrack. We are able to follow this conversation without obvious memory lapses.
I'm not sure you were following because I was asking OK a personal question.
-
One graph is not indicative either way. The sea level does not rise or fall evenly throughout he world, the sea is not flat. For this reason posting one graph is problematic.
Most people are surprised to learn that, just as the surface of the Earth is not flat, the surface of the ocean is not flat, and that the surface of the sea changes at different rates around the globe. For instance, the absolute water level height is higher along the West Coast of the United States than the East Coast.
https://oceanservice.noaa.gov/facts/globalsl.html
Which is what I was alluding to earlier. “Scientists” have been quoting a global mean temperature to predict temperature increases of fractions of degrees. How could you calculate the mean of all the seas when you don’t have every measurement?
-
Sorry, forgot to attach the actual Tide Gauge readings from Williamstown.
There will be a chart related to your capital city tide guage (s) plus quite a lot for regional ports.
The water level at this gauge certainly isn't climbing at the same rate as the concocted "Global Average" calculated figures.
These figures are probably available back to the 1800s but you can't get much flatter than this.


NSW Boeing 737 Fire Bomber
in AUS/NZ General Discussion
Posted
Which post? Fire fighting or one of the others?