Jabiru7252
-
Posts
1,179 -
Joined
-
Last visited
-
Days Won
3
Content Type
Profiles
Forums
Gallery
Downloads
Blogs
Events
Store
Aircraft
Resources
Tutorials
Articles
Classifieds
Movies
Books
Community Map
Quizzes
Videos Directory
Everything posted by Jabiru7252
-
 You are not wrong.
 -
Another Cessna? not fatal thank goodness
Jabiru7252 replied to slb's topic in Aircraft Incidents and Accidents
Perhaps the pilot reported loss of 'bladder' control after engine failure? -
Tricky crosswind landing - of the nautical kind.
Jabiru7252 replied to Garfly's topic in AUS/NZ General Discussion
So I'm sitting here with my freckle tightened up waiting for an almighty boom.... -
Back in the 90's I was flying a Tobago from Waikerie to Tailem Bend. I noticed to my left a plane, and that plane stayed in the same spot on my window for quite some time. We were on converging tracks for Tailem Bend. I did a R.H. orbit to let him get ahead. Had I been sleeping he may not have seen me and that could have been nasty. I guess VOR's and NDB's are concentrating points as well.
-
Did I hear the news correctly?
Jabiru7252 replied to flying dog's topic in Aircraft Incidents and Accidents
My experience with IR suggests the opposite - IR systems need to be cool as possible because the heat would swamp the signal. The IR systems I have played with at work use nitrogen to cool the detectors to -200° C -
Did I hear the news correctly?
Jabiru7252 replied to flying dog's topic in Aircraft Incidents and Accidents
They'll turn it into rocket science! Somebody will develop a system that that does some image processing and moisture measurements and feeds that data into some 'AI' processing neural network thingo that determines if the light should be off or on. Far better than a pilot operating a switch on the dash. -
Just downloaded it to my Samsung tablet. I'll have a play and report back. Only took a minute to setup and activate.
-
The question about background and English was all that showed up in my previous post, there was more but it just disappeared.
-
What's your background - seems English is not your first language...
-
The news report I saw (Ch 9) said the plane flipped. As yet I have no idea what happened. Was it a landing gone wrong or a forced landing?
-
Often I see aircraft identifying as R-NOT-S on Oz Runways. Sometimes it's doing 90kts down low, other times it's at FL30 and doing several hundred knots. Anybody know what the R-NOT-S means?
-
'Flight shaming' and the ethics of recreational flying?
Jabiru7252 replied to NT5224's topic in AUS/NZ General Discussion
If there's going to be a punch-up on this thread, please let me know. I'll grab some popcorn and watch because there is sweet FA on tele, that's for sure..... -
'Flight shaming' and the ethics of recreational flying?
Jabiru7252 replied to NT5224's topic in AUS/NZ General Discussion
If we reduced our use of resources to just 1% of what we use now it wouldn't matter. Population growth is not being addressed and the fact is one day we'll run out of room. Imagine 50 billion or 100 billion trying to eat, sleep, take a dump and stay alive on a planet that struggles with 7.5 billion. -
Well, my Jab has never had a water leak, gearbox problems or unbalanced carbies....
- 219 replies
-
- 10
-

-

-

-
Yea, but out all the trips they did I bet most were lost at sea. These days we seem to create 'touchy-feely-stories' that defy the odds. Some are so ridiculous, it's laughable.
-
Plane crash in NT and one missing in NSW
Jabiru7252 replied to Jabiru7252's topic in Aircraft Incidents and Accidents
It appears the wankers who create the news articles added the 'old' news, creating a false belief. Such unprofessional behavior. -
Work up Monday 13th to hear a 65 yo was killed near Darwin in a plane crash and another plane with two on board is missing in NSW.
-
8 out of 3 are to some degree...
-
Let's say you buy a Hangar for $35,000. You rent it out for $50 a week. That's about thirteen and a half years to get that money back and that's not including any other costs you may incur.
-
Have a look at this link
-
How this comment applies to Ham Radio is amazing. When we actually built our own gear and got it on air - what a thrill that was. Now you buy the gear from China and get on air but hardly know how the stuff works and still think 'skip' is something the radio has. The dumbing down of society is such a crime.
-
My Jabiru shares a hangar with an FK9. I know heaps of folks who have flown the plane and like it. Some say the flap speed is so low that you have to get them up real quick after take-off. One day I'll get a ride in the thing.
-
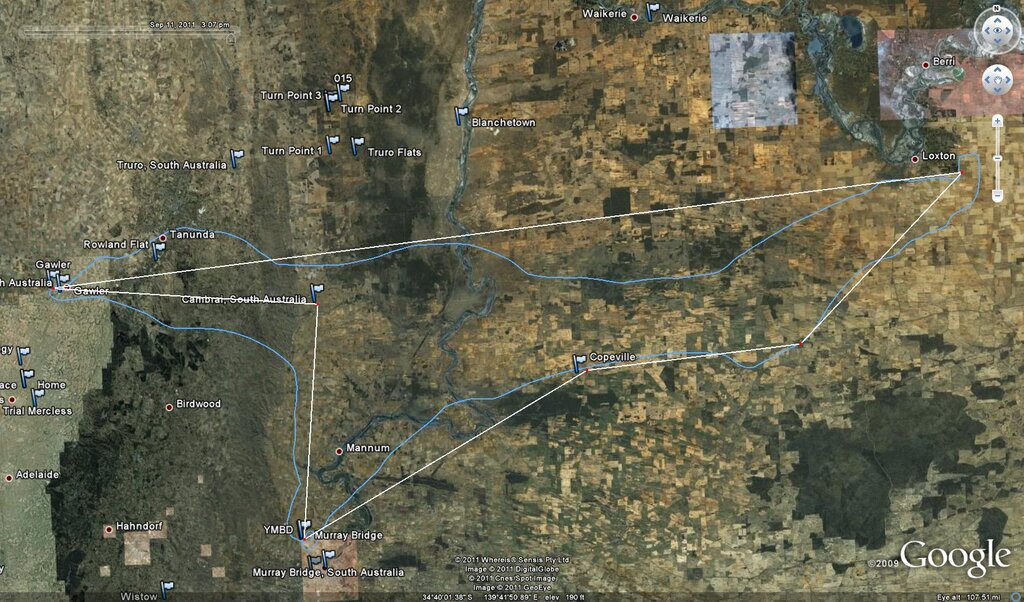
I didn't bother with 1 nm measurements. To fly better than about plus/minus 3 degrees over 60 nm is doing pretty good. Also, without decent ground features to identify the 1 in 60 technique is hard to apply. Here's a track I flew on a wet and windy day. Dodging rain showers made things interesting. The GPS was just logging my track, no display available. Maybe there is no link to the graph, the dude who posted it may have created it himself. I'd like to know what he used as Excel is crap. I use Python for stuff like that.

-
Good Heavens - I learnt the 1 in 60 rule 35 years ago, I didn't think anybody bothered these days, especially with the electronic gizmos. The 1 in 60 rule is used to estimate angles to determine track and heading changes. If you're off track by (say) 30 degrees and have been for (say) 10 minutes you would use diversion procedures to get back on track. Pages 14-19 to 14-27 in book 2 - Meteorology & Navigation by Trevor Thom. The 1 in 60 rule is much easier to apply when you have your track marked on a map with lines every 15nm or so. I only ever used it on big navs that required the WAC and covered hundreds of nm. I am glad I stayed awake during geometry/trigonometry class because that's what the 1 in 60 is all about. I love this stuff, it keeps my remaining neuron active...
-
wow - that's a fine looking digital temperature meter. ? Don't slice yourself open on the sharp fins....?