

Admin
-
Posts
9,328 -
Joined
-
Last visited
-
Days Won
110
Content Type
Profiles
Forums
Gallery
Downloads
Blogs
Events
Store
Aircraft
Resources
Tutorials
Articles
Classifieds
Movies
Books
Community Map
Quizzes
Videos Directory
Everything posted by Admin
-
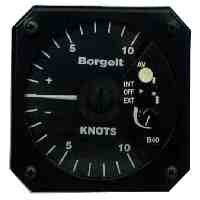 3.4.1 Variometer A variometer is a fast response vertical speed indicator usually scaled to match typical glider rates of climb and descent (+/-10 knots or +/- 5 metres per second). The variometer makes soaring possible by displaying the glider rate of climb to the pilot in near real time, enabling the pilot to manoeuvre the glider so as to remain in rising air. Variometers come in many types, some sense the airflow from a capacity bottle or chamber (as the outside static pressure increases or decreases due to altitude changes, air flows in or out of the chamber to equalise the pressure) either mechanically or electrically; others measure the air pressure directly using silicon pressure transducers and compute rate of climb electronically from the changes measured. All Borgelt variometers since 1982 use this last method. Audio signals which vary with rate of climb/descent are also possible when electronic sensing is used and this is a great help in keeping pilots looking outside the cockpit for other traffic, gliders or birds climbing better in nearby thermals and interesting and/or useful meteorological phenomena. 3.4.2 Vario averagers When circling in turbulent thermals – while our variometer will help us find the best lift – it is sometimes difficult to know how fast we are really climbing (or whether we really are climbing) as there may be sink in part of the circle and lift in others. In this case we can use an averager which is really just a slow response variometer. Most vario averagers integrate or average the variometer readings so that the running average rate of climb of the last circle or so is shown. This requires averaging over 20 to 30 seconds. The averager display may be "on demand" or continuously displayed in digital form. 3.4.3 Total energy variometer The basic variometer described above suffers from the effect that as the glider changes airspeed in response to pilot inputs, large transient rates of climb and descent are induced until the airspeed is stabilised at a new value. These may easily exceed and swamp the rates of climb due to airmass rising and sinking (a 30 degree pullup from 100 knots gives an initial rate of climb of 50 knots, causing the +/- 10 knot scale variometer to peg uselessly at the top of its scale). If, instead of sensing the outside air pressure or static pressure with the variometer, we connect the variometer to a venturi of the correct dimensions we find that as long as the airspeed is constant the pressure in the venturi decreases and increases as in the basic variometer case. If the airspeed decreases due to a pullup the suction produced by the venturi will decrease and will compensate for the reduced static pressure from the climb resulting in no net change of pressure and hence no change in variometer reading. The suction produced by this venturi (pressure below static pressure) is the same as the pressure increase above static pressure measured by a pitot tube at the same airspeed. For the last 25 years the most common and best "venturi" in fact doesn't look like a venturi at all. A 6 mm tube usually extends from the fin leading edge and is bent up or down 70° or so, so that the last 80 mm of the tube is at 20° forward inclination to the airflow. The end of the tube is sealed and the end is cut off square to the tube (NOT parallel to the airflow) and two small holes are drilled in the rear half of the tube as pressure ports. The suction of the device depends on the distance of the holes from the end of the tube. This design is relatively insensitive to yaw (sideslip) and pitch and unlike a real venturi doesn't provide a home for spiders and insects. It is also easy to keep clean (required for correct functioning). As it was invented by Frank Irving it is known as an Irving tube. The generic term for all venturis, probes etc is Total Energy Probe or TE Probe. The total energy referred to is kinetic plus gravitational potential energy. A total energy variometer as described above can be further improved. As described the vario will, in still air, show the glider sink rate at the speed being flown. Let us take a good modern glider such as an 18 meter racer. The unballasted polar curve for this glider will show a minimum sink rate of around 1 knot at around 45 knots IAS, a best L/D of about 50 at around 55 knots and sink rates of about 2 knots at 75 knots and 4 knots at 100 knots. The sink rate through the airmass at typical thermalling airspeed and bank angle will be about 1.6 knots. Now suppose you are cruising between thermals and you encounter rising and sinking air and you vary the airspeed according to Macready 'speed to fly' theory between 60 knots and 110 knots as you encounter rising and sinking air. The vario is TE compensated so changes in airspeed don't cause large transient indications on the vario. However at 110 knots the glider might be sinking through the airmass at 5 knots and at 60 knots at just over 1 knot. These sink rate changes can mask small vertical speed changes in the airmass and make it difficult to pick the best path through the air (which is the path with the most and fastest rising air and the least and slowest sinking air). If encountering a thermal at high speed you may even reject the thermal that is really acceptable. A thermal rising relative to the ground at 8 knots will show as 3 knots up on the vario if you are sinking at 5 knots at 110 knots IAS. In fact after you reduce speed and turn in this air you would climb at 8 – 1.6 = 6.4 knots so it is difficult to use the vario indication to decide whether to accept or reject the thermal being flown through. 3.4.4 Netto variometer A Netto or airmass variometer adds to the raw TE vario reading an upward deflection to counteract the sink due to the glider polar at that airspeed. Now, in still air, the vario will read zero at any airspeed if the polar we have assumed is correct. Even if it isn't the differences are likely to be small fractions of a knot and it is much easier to use the vario to pick the best path through the air. There is one disadvantage and that is if we fly through our thermal rising at 8 knots relative to the ground we see 8 knots on the Netto vario regardless of the airspeed we are flying at. When we slow to circle we climb at 8 – 1.6 = 6.4 knots. So we mentally must subtract our circling sink rate of 1.6 knots to see what rate of climb we will get if we circle now. This is much easier than with our raw TE vario but still adds to workload (for most gliders 2 knots is in fact close enough for practical purposes). 3.4.5 Relative Netto variometer A further refinement of the Netto vario and is sometimes called just relative or super Netto. If we superimpose a downward deflection of 1.6 knots on our Netto variometer we can see that at any airspeed the variometer will show the rate of climb we will get if we circle. This now makes it very easy to use the vario to decide if the thermal is good enough (it isn't the only criterion – you may not have flown through the center – you may already be low etc) but at least the vario is easy to interpret. For picking the best path through the air the relative vario is almost as good as the Netto. Any time that the vario is heading in the upward direction the air is getting better, downwards worse. To get the best of both the Netto and relative vario just mark the 2 knots down position on the outside of the scale with a sliver of white tape. This serves as the "still air" reference point. Any time the vario is above this point the airmass is rising. Do we care about this? Surely we just want the best air? Sometimes it is important in interpreting the meteorology to know if the air is rising or sinking. Also our estimate of how well the glider will go on final glide depends on knowing the absolute rise or fall of the air we fly through. We may be flying in the best available air but if that airmass is sinking at only a fraction of a knot on average we must allow extra altitude for final glide. 3.4.6 Speed command variometer Earlier in the article I mentioned Macready 'speed to fly' theory. Depending on the anticipated strength of the next thermal and the glider polar and the air you are currently flying through there is an optimum indicated air speed to be flying at. A table of speeds is one way to do this, a moveable scale (Macready ring) around the vario is another. If we have the electronics to measure our airspeed to provide a Netto or relative vario we can also use a little more processing to provide a zero reader for the optimum speed to fly. Pointer above zero - pull up, reduce speed. Below - push and gain speed. This is known as a speed command variometer or speed command. Audio signals for "fly faster" and "fly slower" may also be generated. This combines the TE variometer reading with a downward offset controlled by the MaCready or STF (speed to fly) selector (may be a rotary knob or controlled by accessing a menu on screen) and an upward deflection that gets larger as airspeed is increased. If done correctly the result is that you fly at the optimum speed at all times. The speed changes should be made gently so the zero reader indications are usually filtered to slow down the commanded changes. 3.4.7 Effects of altitude It should be noted that the pressure change for any given altitude increment reduces with altitude so variometer calibrations require correction for the effects of altitude. The TE probe will automatically compensate for the effects of altitude. Because the air is less dense at altitude which causes the glider polar to change, Netto, relative and speed command indications also require correction for altitude. The glider polar also changes with the weight of the glider and with the contamination of the airfoil by insects so both the glider weight and the degradation of the polar due to bugs must be accounted for in the Netto, relative and speed command indications. The processing in the B40 Vario and B50 Super Vario takes all the relevant effects into account. STRICT COPYRIGHT JOHN BRANDON AND RECREATIONAL FLYING (.com)
 -
 3.3.1 The atmospheric pressure gradient The random molecular activity or internal kinetic energy within a parcel of air is known as the static pressure and is proportional to the absolute temperature. Static pressure exerts a force on an object (for example, an aircraft wing) at right angles to all the exposed non-porous surfaces, and is measured in newtons per square metre [pascals] of surface. In Australia air pressure is reported as hectopascals [hPa] for meteorological purposes; one hectopascal equals 100 N/m² [or one millibar]. Atmospheric pressure reflects the average density (i.e. mass per cubic metre), and thus the weight, of the column of air above a given level. So, the pressure at a point on the Earth's surface must be greater than the pressure at any height above it, in that column. An increase in surface pressure denotes an increase in mass — not thickness — of the blanket of air above the surface location. Similarly, a decrease in surface pressure denotes a decrease in the mass of air. The air throughout the column is compressed by the weight of the atmosphere above it, thus the density of a column of air is greatest at the surface and decreases with increasing altitude. However, a warmer air column will be thicker — i.e. extend further upwards — than a cooler air column with the same surface pressure. Thus a particular pressure level will be at a higher elevation in the warmer column. This means that the level in the atmosphere at which any particular pressure occurs is also dependent on the temperature (or thickness) of the air column. Meteorological offices produce 'height contour and thickness charts' to determine the locations of upper level troughs and ridges. 3.3.2 Atmospheric density The average density of dry air in mid-latitude, temperate climates, is about 1.225 kg/m³ at mean sea-level; the density decreases with increasing altitude. There are several gas laws that relate the temperature, pressure, density and volume of air. The equation most pertinent to aeronautical needs is the equation of state: r = P/RT where: r* = air density kg/m³ P = static air pressure in hectopascals [hPa] R = the specific gas constant for dry air = 2.87 T = air temperature in kelvins [K] = °C + 273 *r is the Greek letter rho, pronounced 'row', as in 'row your boat'. By restating the equation of state as: P = 2.87rT , it can be seen that if density remains constant; pressure increases if temperature increases. We can calculate the ISA standard sea-level air density, knowing that standard sea-level pressure = 1013 hPa and temperature = 15 °C or 288 K i.e. Air density = 1013 / (2.87 × 288) = 1.225 kg/m³ = ro* If the air temperature happened to be 30 °C or 303 K at the same pressure, then density = 1013 / (2.87 × 303) = 1.165 kg/m³, or a 5% reduction. *ro — the symbol for the standard sea level density is pronounced 'rho zero', or 'rho nought' if you prefer. 3.3.3 The ICAO International Standard Atmosphere The International Civil Aviation Organisation's [ICAO] International Standard Atmosphere [ISA] provides a fixed standard atmospheric model that is used for many purposes, among which are the uniform assessment of aircraft performance and the calibration of some aircraft instruments. The model is based on average climatic conditions in 40–45° North latitudes, but contains the following assumptions: dry air (no water vapour present) is assumed throughout the atmosphere so the effects of humidity on air density are ignored the mean sea-level [msl] pressure = 1013.25 hPa the msl temperature = 15 °C [288 K] the tropopause is at 36 090 feet [11 km] and the pressure at the tropopause = 226.3 hPa the temperature lapse rate to 36 090 feet = 6.5 °C per km, or very close to 2 °C per 1000 feet the temperature between 36 090 and 65 600 feet [20 km] remains constant at −56.5 °C. The table below shows a few values derived from the ISA. Those pressure levels noted with a flight level designator (FL) are standard pressure levels, rounded to the nearest increment of 500 feet, used for aircraft operating above the altitude transition layer and also for aviation weather purposes, particularly thickness charts. hPa °C kg/m³ feet Pressure Flight level Temperature Air density Altitude 1013 15.0 1.225 msl 1000 14.3 1.212 364 977 13.0 1.190 1000 950 11.5 1.163 1773 942 11.0 1.155 2000 908 9.0 1.121 3000 900 8.6 1.113 3243 875 7.0 1.088 4000 850 A050 5.5 1.063 4781 843 5.1 1.056 5000 812 3.1 1.024 6000 800 2.3 1.012 6394 782 1.1 0.993 7000 753 – 0.9 0.963 8000 750 –1.0 0.960 8091 724 – 2.8 0.933 9000 700 A100 – 4.6 0.908 9882 696 – 4.8 0.905 10 000 650 – 8.3 0.855 11 780 600 FL140 –12.3 0.802 13 801 550 –16.6 0.747 15 962 500 FL185 – 21.2 0.692 18 289 450 – 26.2 0.635 20 812 400 FL235 – 31.7 0.577 23 574 350 – 37.7 0.518 26 631 300 FL300 – 44.5 0.457 30 065 250 FL340 – 52.3 0.395 33 999 200 FL385 – 56.5 0.322 38 662 150 FL445 – 56.5 0.241 44 647 100 – 56.5 0.161 53 083 It can be seen that (from sea level to 10 000 feet) air density decreases by about 33 grams/m³ per 1000 feet. Also, not immediately apparent from the ISA table, is that the pressure lapse rate (the rate of change with height) is exponential. It starts at about one hPa drop per 28 feet height increase, then slowing to 31 feet per hPa at 6000 feet (averaging 30 feet height increase per hPa drop up to 6500 feet), 36 feet per hPa at 10 000 feet, 50 feet at 20 000 feet and so on. However, the following provides a useful rule of thumb: Rule of thumb #1 "For operations below 10 000 feet, an altitude increase (decrease) of 30 feet can be assumed for each one hPa pressure decrease (increase) and for an estimate of air density multiply the altimeter indicated altitude in 1000's of feet by 30 to find the value to deduct from 1.225 kg, e.g. at 6500 feet; 6.5 × 30 = 195 and 1.225 kg minus 195 grams = 1.03 kg." But bear in mind that the ISA model is unlikely to reflect current atmospheric conditions at a particular location, see high density altitude. 3.3.4 Bernoulli's principle and the continuity equation Bernoulli's principle Daniel Bernoulli (1700-1782) was a Swiss mathematician who propounded the principle that for a given parcel of freely flowing fluid, the sum of gravitational potential energy, kinetic energy and static pressure energy always remains constant. For our aerodynamic purposes we can ignore the gravitational potential energy. Dynamic pressure = ½rv² and kinetic energy = ½mv² where m = mass. Air density is mass per unit volume; i.e. kg/m³ so dynamic pressure is the kinetic energy per unit volume. Static pressure is internal kinetic energy per unit volume, or pressure potential energy. So, for our purposes (in a parcel of freely flowing air), Bernoulli's principle can be reduced to: ½rv² [dynamic pressure] + P [static pressure] = constant The statement doesn't take into account viscosity, heat transfer or compressibility effects, but for operations below 10 000 feet and airflow velocities below 250 knots, compressibility effects can be ignored — thus no change in flow density [r] is assumed. The statement then indicates that, in a free stream flow, if speed [v] increases static pressure [P] must decrease to maintain constant mechanical energy per unit volume; and the converse — if speed decreases, static pressure must increase. Or, turning it around, a free stream airflow will accelerate in a favourable pressure gradient and decelerate in an adverse pressure gradient. Bernoulli's principle doesn't apply in boundary layer flow because the viscosity effects introduce loss of mechanical and thermal energy (transferred to the aircraft skin) due to the skin friction. (Incidently Daniel Bernoulli's father Johann [born 1667] was the mathematician who first adopted the symbol 'g' for the acceleration due to gravity.) Stagnation pressure Another aspect of Bernoulli's principle is that the constant is the stagnation pressure — the pressure energy needed to halt the airflow — thus it can be written ½rv² + P = stagnation pressure. The stagnation pressure is the highest pressure in the system. This application of the principle is apparent in the air speed indicator, as demonstrated below. Stagnation pressure is the basis of the ram-air parachute wing used in sport parachutes, paragliders and powered parachutes, see 'The ram-air parachute wing'. Also aircraft fuel-tank vents face into the airstream and rely on stagnation pressure to prevent inflight siphoning of fuel from the tank. The continuity equation There is another principle of aerodynamic interest to us — the fluid flow continuity equation — which states that, in a steadily moving airstream, the product of density, cross sectional area [s] and speed must always be a constant: r × s × v = constant If there is no change in density within the flow (which is the norm in the airspeed range of light aircraft; see compressibility effects) then we can state that: s × v = constant Thus, if air flows into a smaller cross-sectional area speed must increase to maintain the constant. Bernoulli's principle states that if speed increases, static pressure must decrease; so the velocity of a constricted airstream increases and its static pressure decreases. Both the above principles are related to the conservation laws; Bernoulli's principle to the conservation of energy, and the continuity equation to the conservation of mass. We will examine these properties of air further in the 'Aerofoils and wings' module. The venturi effect — used in carburettors, the total energy variometer and the airframe-mounted venturi that provides suction for some flight instruments — is an application of the principles stated above. 3.3.5 Measuring airspeed The dynamic pressure of the airflow, in N/m², is represented by the expression ½rV², where: r is the ambient density of the air [kg/m³ ] ( ro is the symbol for the standard sea-level density of 1.225 kg/m³ ) V² is the aircraft (or free airstream) speed [m/s²] and we can deduce that the apparent speed of the airstream is related to air density and dynamic pressure. *Note: a lower case v is the symbol for speed in physics while an upper case V is generally the symbol for the free stream speed in aerodynamics, which is why I have used the lower case v in section 2.4 but an upper case V in this section and most of this flight theory guide.) We can measure the dynamic pressure with a simple mechanical pressure gauge. Imagine a 6 mm internal diameter aluminium tube positioned under the wing of a moving aircraft, outside the slipstream, so that the open end points forward into undisturbed airflow and the other end of the tube terminates within a spring-loaded, flexible capsule — similar to that in an aneroid barometer — thus the capsule stops the airflow within the tube. The back pressure, applied by the capsule to stop the airflow, must be equal to the stagnation pressure. The capsule is contained within a casing which, in turn, is connected to a static vent that supplies the casing with the ambient atmospheric pressure; or, in a lower-quality system, the casing may just be open to the atmospheric pressure within the fuselage. So, if we have stagnation (or impact pressure or ram-air pressure) — which is dynamic pressure plus static pressure — within the capsule and static pressure surrounding it, the capsule will expand or contract to reflect the changes in dynamic pressure at the mouth of the tube. (The system is a 'pitot tube' devised by Henri Pitot (1695-1771). During World War I, the airspeed indicating instruments themselves were called 'pitots'.) The capsule movement is mechanically or electrically linked to rotate a pointer on a dial. Although the dial is calibrated and marked to indicate airspeed in knots or mph rather than hPa, it is still basically a simple pressure gauge and an imperfect airspeed gauge. Because the instrument cannot determine the density component of the dynamic pressure, the calibration assumes a constant air density of 1.225 kg/m³. This cockpit instrument is then an airspeed indicator [ASI] and it displays the indicated airspeed [IAS], based on ISA conditions. The indicated airspeed is not the actual aircraft speed through the air, 'V' in the equations. A bit confusing — but brace yourself, for it gets worse! We can calculate the dynamic pressure for the Jabiru using the scenario in section 1.4 for calculating CL; i.e. cruising at 6500 feet, true airspeed 97 knots or 50 m/s, and air density 1.0 kg/m³. The ISA atmospheric pressure at 6500 feet is about 800 hPa. • static pressure = 800 hPa • dynamic pressure = ½rV² = ½ × 1.0 × 50 × 50 = 1250 N/m² = 12.5 hPa Note that the dynamic pressure at 1250 N/m², or 12.5 hPa, is less than 2% of the static pressure, but applying that dynamic pressure over the 8 m² of wing area and the lift coefficient of 0.4; i.e. 1250 × 8 × 0.4, still gives the lift force of 4000 newtons that we calculated in the 'Lift' section. The airspeed 'V' in the equations is the true airspeed [TAS] — the free stream speed or the air distance flown over time. We know that the ASI dial is calibrated assuming a fixed air density of 1.225 kg/m³ [ro ], so a perfect ASI will only indicate the real airspeed (the true airspeed) when the actual environment density is 1.225 kg/m³; that could only occur when the aircraft is operating at low altitude. What will be the IAS (Vis) of our example in the preceding box? IAS = Vis = V / √(ro / r) = 97 divided by the square root of 1.225 divided by 1.0 = 97 / 1.1 = 88 knots From this we can deduce that a perfect ASI will generally underread. The IAS will always be less than the TAS, except in very cold conditions at low altitude where the air density may be greater than 1.225 kg/m³. For instance, using the equation of state above, if temperature was –3 °C and pressure was 1030 hPa, the density would be 1.33 kg/m³. Density is about 1% less than (greater than) the ISA value for each 3 °C that the temperature is above (below) the ISA value. 3.3.6 Indicated and calibrated airspeed The ASI as an angle of attack indicator So, you might ask, what's the point of an ASI that really is indicating just dynamic pressure, and is unlikely to indicate your real airspeed — air distance flown over time — accurately? Well, admittedly it does mean a little more calculation to be done in navigation, but there are very significant advantages with an instrument that displays IAS rather than TAS. This will be covered in the 'Aerofoils and wings' module. Generally, for all angles of attack in unaccelerated flight at a particular weight, there is a corresponding IAS; though the relationship between aoa and IAS does get a bit fuzzy near CLmax. So, in the absence of an angle of attack instrument, the ASI can generally* be regarded as an indication of angle of attack if the lift being produced matches aircraft mass. Also, all the performance parameters (the 'numbers') for an aircraft — best rate of climb, best angle of climb, best glide angle, etc. — require it to be flown at a particular aoa for that weight, and thus a particular IAS. Or more accurately, a particular calibrated airspeed [CAS] and that particular CAS does not change with altitude (as TAS does), but changes only with weight. *The reason why CAS does not always correlate to aoa in level flight is that when inertia and random displacement forces — atmospheric turbulence — come into play, aoa may change momentarily without a noticeable change in CAS. (Note: there are means of audibly conveying the angle of attack to the pilot. The simplest is a stall warning horn operated by a basic two-position vane switch incorporated in the leading edge of the wing and switched on by the airstream pressing the vane up if the aoa comes close to the stalling aoa. There are other airstream direction detectors (ADDs) that provide a range of warning tones in the pilot's headset.) Calibration of the aircraft's airspeed indicator system An ASI is an imperfect mechanical instrument which is subject to instrument errors; the poorer the quality of the instrument the greater the instrument error; the permissable limit for a certified ASI is ±one knot. The associated pitot/static and tubing system is also prone to pressure sensing errors due to the positioning (and design) of the the static air vent —and possibly the pitot head — relative to the airstream. Relative airflows change as aoa changes and when slipping or yawing. It is difficult to find a site on the fuselage for a static vent where the static pressure reflects the ambient static pressure. So after construction is complete the aircraft's airspeed indicating system must be 'measured' to determine the rectifications to be made to the airspeed reading indicated on the ASI. CAS is the airspeed after you have applied corrections to the IAS for those instrument and position errors occurring at that aoa in that particular aircraft. The measured corrections should be stated on a card placed near the ASI. You should also be aware that position errors may be quite significant, possibly under-reading by 10 knots or so — particularly at high aoa or when the pilot is maintaining a significant sideslipping manoeuvre. CAS may also be known as the rectified airspeed [RAS]. Below is an airspeed correction card for a particular aircraft in balanced level flight; i.e. not slipping or skidding. The normal cruise speed for this aircraft is around 95 knots. In this particular installation the ASI significantly underreads at low speeds and overreads at high speeds. IAS knots 42 52 61 69 73 87 96 104 113 122 130 CAS knots 49 57 64 71 73 86 94 102 110 117 125 Converting CAS to TAS TAS = CAS × √(ro / r) Using our example, from section 2.5, of the Jabiru cruising at 88 knots IAS at 6500 feet, where the air density is 1.0 kg/m²: TAS= 88 × √(1.225 / 1.0) = 88 × 1.107 = 97 knots We need TAS for navigation and as the density lapse rate just about follows a straight line below 10 000 feet – there is a simple mental calculation to determine TAS from CAS: Rule of thumb #2 "To convert CAS to TAS, multiply the (density) altitude, in 1000s of feet, by a factor of 1.5 to get the percentage increase to apply." (For calculation of density altitude see 'High density altitude: effect on take-off/landing performance'.) e.g. CAS = 88 knots at 6500 feet = 6.5 x 1.5 = 10% = 97 knots. The multiplication factor increases slightly with increasing altitude, reaching 2 at 30 000 feet. The airspeed indicator You will note the green and white peripheral arcs, and other colour marks, on the face of this instrument. These are standard markings, some of which should appear on the face of every light aircraft ASI, as they display the speed constraints applicable to the aircraft operations. The white arc indicates the flaps operating range starting, at the lower end, from the indicated airspeed, Vso [55 knots], at which the aircraft will stall in the landing configuration with flaps fully extended, and with the throttle closed. The top end of the white arc indicates the maximum speed, Vfe [108 knots], at which the aircraft's flaps can be extended, or remain extended, without causing strain. The bottom end of the green arc indicates the stalling speed of the aircraft, Vs1 [62 knots], with flaps (and landing gear if applicable) up, throttle closed and 1g load factor. The top end of the green arc indicates the maximum structural cruise speed, Vno [173 knots]. The green arc indicates the designed range of speeds for normal operations. The yellow arc indicates a speed range in which the aircraft may be flown, but with caution and only in smooth atmospheric conditions. The red line at the top end of the yellow arc indicates the speed, Vne, that should never be exceeded because of risk of structural damage. The other red mark at 70 knots, and the blue mark at 88 knots, are of no interest for single-engine aircraft; these markings only appear on a twin-engine aircraft ASI and relate to operations with one engine shut down. A properly functioning ASI responds rapidly to pressure changes because there is no instrument lag. A slow response attributed to instrument lag is most likely only due to the inertia of the aircraft — when attitude in pitch is changed, an aircraft takes a little time to accelerate/decelerate to the appropriate airspeed. Airspeed summary True airspeed [TAS] = V in the dynamic pressure equation and other expressions = air distance flown over time. Indicated airspeed [IAS] = Vis = airspeed displayed on the cockpit airspeed indicator [ASI] — based on a fixed air density ( ro ) of 1.225 kg/m³. The ASI only indicates true airspeed when ambient atmospheric density is actually 1.225 kg/m³ and the system error corrections are applied. Calibrated airspeed [CAS] = IAS adjusted (mentally from an airspeed correction card) for known system errors occurring within the normal speed range. Electronic ASI Electronic flight instrument systems [EFIS] use solid state electronic componentry as sensors plus software to display flight data on a single screen. In such systems, the static and dynamic pressures are fed to pressure transducers which sense and convert pressures to voltages that the electronic circuitry converts to an airspeed display. See the liquid crystal primary flight display of the Dynon D10A light aircraft EFIS. The EFIS has an outside air temperature probe and, with static pressure, the software can calculate air density and thus display TAS when needed. Electronic ASIs are also available as single panel instruments or possibly combined with an altimeter function. The electronic systems are still subject to much the same errors as a mechanical system, and the IAS has to be corrected for CAS unless there is a means for incorporating some form of compensating table into the software. 3.3.7 Measuring rate of ascent/descent The vertical speed indicator In flight it is important for a pilot to know the rate at which the aircraft may be ascending or descending. A simple vertical speed indicator [VSI] is a pressure gauge that measures the rate of pressure change as an aircraft is ascending or descending. The instrument display is usually calibrated in feet per minute but it may be in metres per second. There are two pressure inputs, both from the static vent system — one to each side of a flexible diaphragm or capsule. On the open side there is a normal input that reflects the static pressure change as it occurs. On the closed side the input/output is a fine capillary tube that slows the equalising pressure change — and also the response time of the instrument. The resultant deflection of the diaphragm is magnified via a geared mechanical linkage to a dial pointer, which indicates whether the aircraft is maintaining altitude (in which case, the pressure on both sides of the diaphragm is equal), climbing or descending, and the rate, usually graduated in feet [×100] of altitude per minute. Some form of vibration damping and thermal change compensation is included within the VSI and ASI instruments. The pressure change has two components, the most significant component is that brought about by the aircraft's rate of height change, as in climbing or descending. The other part is any vertical movement of that part of the air mass in which the aircraft is operating — rising air or sinking air. When an aircraft is climbing, rising air adds to the rate of change, sinking air reduces it. When descending, rising air decreases the rate of change, sinking air adds to it. The variometer In soaring flight, paraglider, hang glider, sailplane and power-assisted sailplane pilots are totally reliant on finding sources of atmospheric uplift to gain the gravitational potential energy that enables the aircraft to stay airborne for sufficient time to complete the flight plan. A variometer (usually abbreviated to vario) is a specialised vertical speed indicator that enables a pilot to derive the vertical speed of the parcel of air in which the aircraft is soaring. For more information on varios and their uses see the article 'Basic sailplane instruments. The article only refers to fixed installation varios but very light-weight hand-held varios are available for hang glider/paraglider pilots. 3.3.8 Stalling airspeeds The normal 1g stall One of the first questions a pilot might consider, when converting to a new aircraft type, is "What's the stall speed?" The reason for considering this is that usually, but not always, the approach speed chosen for landing is 1.3 to 1.5 times Vso — the minimum steady flight speed in the landing configuration, below which speed the aircraft will stall or at which speed the aircraft will stall if any manoeuvring is attempted. In aerodynamic terms, the 'stall' is the sudden widespread separation of the boundary layer from the upper wing surface that occurs when the wing exceeds a particular angle of attack. For light aircraft without high-lift devices, this is usually around 15–16° although minimum aircraft with single-surface fabric wings may have a stall aoa 2–3° lower. This critical angle of attack has no relationship with either the aircraft attitude relative to the horizon or the airspeed — it can readily be reached in a high-speed dive. But it does have a direct relationship with elevator position and thus the control column position. The separation of the boundary layer starts at the wing trailing edge, generally near the wing root for approximately rectangular wings (and particularly for wings with 'washout'), spreading forward and outward over the upper surface until there is a significant detachment of boundary layer flow over the upper surface. There is probably little change to the under-surface boundary layer flow. Between the two remnant boundary or shear layers, a thick turbulent wake will attach to the wing and be dragged along by the aircraft. The reaction to the acceleration and energising of that wake is a sudden deceleration of the aircraft accompanied by a large increase in the nose-down pitching moment plus some loss of lift. The initial wake turbulence ('burbles') near the wing root may initiate unsteady flow over the tailplane, shaking the tailplane and thus providing a few warning buffets felt in the airframe or smaller 'nibbles' felt in the controls — aerodynamic warnings of an impending stall. There also may be 'oil-canning' noises from pressure changes on metal-skinned fuselages and wings as the thin metal flexes in response to pressure changes. On the other hand, there may be no pre-stall warning whatsoever. Some aircraft exhibit undesirable characteristics even before boundary layer separation occurs; for example, the aircraft starts sinking excessively with increasing induced drag or wing rocking occurs. So, from a pilot's point of view, a stall is "the point following deceleration at which the pilot ceases to have full control over the aeroplane"; which adds the concept of the defined stall speed being a minimum controllable steady flight speed at which no undesirable characteristics are exhibited. The next comments are specifically aimed at stalls induced when: • flying straight and level at slower speeds • in a low speed descent — such as the approach to landing • in a climb — such as the initial climb after take-off • in a go-around following an aborted landing approach. The last two circumstances are sometimes referred to as full-power stalls or 'departure stalls'. In non-turbulent atmospheric conditions, and if the aircraft is in balance, all of the circumstances above can only induce a stall if the control column position is placed in, trimmed into or allowed to move into, the last half of its rearward travel. Many aircraft are designed so that the control column must be at or near the limit of its rearward travel to reach the stalling aoa. (The rearward travel range commences from the neutral position, as does the forward travel range.) Because of the airflow turbulence and increasing induced drag as the aoa is increasing, total drag increases and the aircraft slows as it approaches CL max. The rapid reduction in airspeed after passing the critical aoa means the wing is now unable to provide sufficient lift to totally balance weight and, in a normal stall, the aircraft starts to sink. The (possibly pronounced) nose-down pitch will occur even though the control column is near its rearward travel limit. However, some aircraft may not assume that nose-down attitude but just sink (mush down) at quite a high rate and at an extreme angle of attack. Because of the nose-up attitude, the high rate of descent may not be apparent unless the aircraft is close to the ground. The aircraft is instantly recovered from the stall by smoothly reducing the aoa so that it is below the critical aoa; i.e. easing the control column forward and generally no further than the neutral position. If one wing stalls before the other, that wing will drop. In this case, the control column must be firmly moved sufficiently forward to unstall the dropping wing, the wings levelled with aileron then sufficient rudder applied to stop further yaw. An increase in speed is also needed (by increasing power or holding a lower nose attitude for several seconds) so that a safe flight speed is achieved quickly without wasting much altitude and the aircraft is returned to the intended flight path. See standard recovery procedure for all stall types. If the control column movement for stall recovery is both excessive and abrupt, the result could be an aoa movement below the zero lift aoa — in which case there will be a reversed lift force on the wings, which hinders recovery. Weight-shift controlled trikes do not react well to negative g; if this is excessive, the wing spars may buckle at an outer position. Many aircraft are designed so that the nose will drop at the stall, but the aircraft will self-recover (i.e. without pilot intervention) in a stable descent or with some oscillations which, if the control column is still held back, will result in another stall. Some aircraft may be designed so that the wing is usually not able to reach the stalling angle, but the aircraft will enter a semi-stable mushing descent — which sounds fine but can be disastrous if the pilot doesn't notice when close to the surface. A normal stall occurs when the load factor is close to normal; i.e. near 1g. The cg position will also affect the manner of stall. If the cg is at the extreme forward limit, some aircraft may not fully stall — just mush down. If it is too far aft, the stall aoa can be reached with a much smaller rearward movement of the control column. Another factor affecting the manner of stall is the use of power. Generally, when flying slowly, the longitudinal axis of the aircraft is pitched up relative to the flight path. Consequently the thrust vector will include a vertical component — a lifting force — and the amount of lifting force provided depends on the amount of thrust. Also, for aircraft with the propeller mounted in front of the wings, the energy in the slipstream tube in slow flight increases the velocity of the airstream over part of the wing (depending also on the mounting of the wing in relation to the thrust centre line) and reduces the aoa of that part. Thus the completely stalled wing may occur at a lower speed, depending on the amount of power in use. When it occurs, the stall will be much more pronounced, possibly with a fast-acting wing drop. There are other complications because the slipstream also affects parasite drag and induced drag. Many pilots, in suitable aircraft and atmospheric conditions, prefer to land by approaching at 1.3 to 1.5 times normal stall speed — Vso — and, after flaring with the throttle closed, holding the aircraft just above the surface; preventing it touching down by smoothly increasing CL as drag decreases V², thus maintaining constant lift until CLmax is reached. At this point, the aircraft can no longer be 'held off' and it gently sinks the short distance onto the runway, touching down in a nose-high attitude. The acceleration or accelerated stall It is misleading to talk about stalling speed without further definition. The stall occurs at a particular aoa, not a particular speed. The speed — Vs — below which the stall will occur depends on the load factor. If the aircraft reaches the critical aoa under a load higher than 1g, the stalling speed will be higher than the normal 1g stall speed, at that mass. This latter stall is called an acceleration stall or accelerated stall and is usually more pronounced than a normal stall. The load factor normally increases in a turn— as we saw in section 1.10 where we calculated that, in a 45° banked turn, the load factor was 1.41 times normal. Thus, when turning, the stalling speed is higher than normal and the pilot must maintain a reasonable airspeed margin above that accelerated stall speed throughout the turn. See the table below. Be aware that the airspeed at which an acceleration stall in a turn occurs is only indirectly associated with the angle of bank; it is directly brought about by the increase in load factor. Indeed, it is possible to have the aircraft banked at 60° with a stall speed less than Vs1 if the wings are 'unloaded': slight forward pressure on the control column, and the aircraft allowed to sink, produces a load less than 1g — maybe 0.8g — with a stall speed less than Vs1, even though the aircraft is steeply banked. However, once the 'unloaded' condition ceases — if the stalling angle of attack has been passed (either by the rearward movement of the control column or a gust momentarily changes the relative airflow) — the probability of a stall returns immediately. The speed at which an accelerated stall occurs is proportional to the square root of the load factor — in the lift equation the airspeed is squared. If that load factor is expressed relative to the normal load, e.g. 2g, then the stall speed at that load factor — Vs 2g — equals the square root of the load factor × normal 1g stall speed; e.g. square root of 2 = 1.41 × Vs. The aircraft's momentum may also contribute to an accelerated stall, particularly when the aircraft is diving at speed and the pilot applies a harsh rearward control column movement. This will have the initial effect of rotating the aircraft about its lateral axis while inertia momentarily maintains the aircraft on its pre-existing flight path; thus the aoa may exceed the stalling aoa (even though the control column has not been pulled back to the normal stall position) with a consequent, and rather violent, high-speed stall. An acceleration stall can also be produced when: • the control column is jerked back whilst the aircraft is climbing or in level flight; see the flick roll • an aircraft in level cruising flight encounters a strong vertical gust • an abrupt change in flight path is made, which applies acceleration loads • an excessive bank angle, coupled with excessive control column back pressure, is applied during a level, climbing or descending turn. Note: The US Federal Aviation Regulations Section 23.203 airworthiness standards define accelerated stalls somewhat differently from the above, only referring to 'turning flight stalls' and 'accelerated turning stalls' for airworthiness demonstrations. "Turning flight and accelerated turning stalls must be demonstrated in tests as follows: (a) Establish and maintain a coordinated turn in a 30 degree bank. Reduce speed by steadily and progressively tightening the turn with the elevator until the airplane is stalled. The rate of speed reduction must be constant, and-- (1) For a turning flight stall, may not exceed one knot per second; and (2) For an accelerated turning stall, be 3 to 5 knots per second with steadily increasing normal acceleration*." * 'Normal acceleration' refers to the aerodynamic force parallel to the aircraft's normal axis. Load factor in a turn The table below shows the increase in stall speed at various bank angles in correctly executed level turns. The load factor or 'g' = 1/cosine of the bank angle and the Vs multiplier = the square root of the load factor. The table shows that once you reach bank angles of 30° or more, the aircraft stall speed increases rapidly; there is a 7% increase at 30°, 19% at 45° and 41% at 60°. Thus, level turns involving bank angles exceeding 20–30° should not be made at low levels, including take-off and landing operations. Even so, the airspeed should be increased to allow an appropriate safety margin — for gentle turns, a safe speed near the ground is 1.5 × Vs. The stall speed in a turn = Vsturn = Vs × Vs multiplier. A minimum turning speed at a safe height might be 1.2 × Vsturn. For example, if Vs is 50 knots and the bank angle is 45° then Vsturn is 50 × 1.19 = 60 knots and the minimum safe turning speed at height is 1.2 × 60 = 72 knots, or about 1.45 × Vs. Bank angle Cosine Load factor [g] Vs multiplier 10° 0.98 1.02 1.01 [+1%] 20° 0.94 1.06 1.03 [+3%] 30° 0.87 1.15 1.07 [+7%] 40° 0.77 1.30 1.14 [+14%] 45° 0.71 1.41 1.19 [+19%] 50° 0.64 1.56 1.25 [+25%] 54° 0.59 1.7 1.3 [+30%] 60° 0.50 2.00 1.41 [+41%] 70° 0.34 2.94 1.71 [+71%] 75° 0.25 4.00 2.00 [+100%] Note that the stall speed increases exponentially with bank angle; i.e. the 10° increase in the bank angles between 20° and 30° increases stall speed by another 4%, while the 10° increase in the bank angle between 50° and 60° increases stall speed by a further 16% (i.e. four times as much), while between 60° and 70° the stall speed is increased by a further 30%. Consequently aircraft certificated in the normal category are limited to a turning angle of bank of not more than 60°. Note that at an approach speed of 1.3 × Vs the aircraft will stall if turning with a 54° bank. The limits on climbing and descending turns are discussed in the 'Safety: control loss in turns' module. The torque stall For high-performance aircraft, with a very high power-to-weight ratio, the possibility of a torque stall exists. The most likely scenario is a sudden application of full power in a 'go-around' following an aborted landing, where the airspeed has been allowed to decay below the safety speed. The torque of the engine and inertia of the heavy propeller tends to twist the aircraft around the propeller shaft, and the consequent roll may increase the aoa of the downgoing wing past the critical aoa. If that happens, the wing loses lift, which accelerates the roll and the aircraft loses height very rapidly. However, torque stalls are probably not applicable to light aircraft, although the torque effect may influence the characteristics of a stall in a climbing turn. Effect of weight If the aircraft is below its MTOW, the operating wing loading will be less than the design W/S and the stall will occur at a lower speed than that marked on the ASI. For example, if we refer to the Jabiru, the wing area is 7.9 m², MTOW is 4200 N, Vso is 40 knots CAS and we can calculate that CL with flaps fully extended is 2.0. We saw above in the section 'The acceleration or accelerated stall' that W/S at the stall = CL × ½rV². We will rearrange that and say Vs² = (W/S) / (CLmax × ½r). Substituting the values, including 1.225 for density, we get: Vs² = (4200/7.9) /(2.0 × 0.5 × 1.225) = 532/1.225 = 434 m/s and Vs = 20.8 m/s = 40 knots CAS Now what will Vs be when the Jabiru with no passenger on board is at the low weight of 3400 N? Well, substituting that weight we get: Vs² = (3400/7.9) /(2.0 × 0.5 × 1.225) = 430/1.225 = 351 m/s and Vs = 18.7 m/s = 36 knots CAS. There are other, somewhat simpler, ways to calculate the reduction in Vs corresponding to a reduction in weight but what we see above is that a reduction in weight of 800 N, or about 19%, reduces Vs by 4 knots, or about 10%. This brings us to the mathematical rule of thumb that when two values are not that far apart in percentage terms, say up to 40%, their square roots are about half that distance apart in percentage; and because aerodynamic pressure is proportional to V², there are many occasions where the square root of a value is relevant. This allows a simple, but reasonably accurate, mental calculation: Rule of thumb #3 "The percentage reduction in Vs is half the percentage reduction in weight." i.e. If weight is reduced by 10% from MTOW then Vs will be reduced by 5%, and conversely, if weight is 10% over MTOW then Vs will be 5% higher — one of several reasons to avoid overloading an aircraft. (There is further discussion on weight control throughout these notes.) Thus in the section 'The acceleration or accelerated stall' above, where we referred to unloading the wings with the aircraft banked at 60°, the load reduction from 1g down to 0.8g is 20% so the unloaded stall speed would be about 90% of Vs1. You can also see the same relationship in the preceding table; for bank angles up to 45° the percentage increase in Vs is about half the percentage increase in W/S. It is appropriate to mention here that it is not only aircraft weight/wing loading that affects the stall speed. Some of the other critical performance values are also achieved at a particular aoa, and the associated airspeeds are also changed by a change in weight. The same rule of thumb applies to them. These critical performance values (the 'numbers') are: best rate of climb speed, best angle of climb speed, lowest power-off sink rate speed, best glide ratio speed and manoeuvring speed. Another aspect we will look at in the 'Aerofoils and wings' module is the effect of flaps, but we will just state here that flaps provide an increased CL at all angles of attack consequently allowing a reduction in V² and the stalling speed. In some aircraft extending flaps also increases wing area, thus W/S is reduced, a handy technique for high-performance military aircraft, manoeuvring at maximum allowed wing loading — they can tighten the turn even further without breaking the aircraft. The final aspect of the stall is the effect of atmospheric turbulence on aoa and this affects 'manoeuvring speed'. We will look at it in the 'Wind shear and turbulence" tutorial. 3.3.9 V-speeds Airspeed codes It is important to have a simple, easily understood and universally accepted identification method for the various airspeeds at which an aircraft may be operated, but currently it's a bit messy and there is no complete, unambiguous, and universally recognised, airspeed designation system published by any regulatory authority. Current nomenclatures are generally made up of two to six letters/numbers, with the first being V. Some of these V-speed codes — applicable to single-engine aircraft — with alternatives and definitions are shown below. These are relevant to sport and recreational aircraft including low momentum ultralight aircraft, and might appear in flight manuals, pilot's operating handbooks and even sales literature but those indicated with open bulleting º are probably only applicable to a few very light aircraft types. There are two classes of airspeed codes. One is the structural design speeds (specified in national airworthiness requirements) used in determining the airframe and control surfaces strength requirements for type certification. Such speeds include the term 'design' in their description. The other class are the designer recommended operating speeds. Please be aware that the various 'best' performance speeds mentioned below — rate of climb, angle of climb, cruising range, gliding range, etc. — merely indicate the midpoint in an airspeed range extending perhaps 1–2% either side of that point. Also, the performance speeds are very much affected by the horsepower of the particular engine fitted, plus the type of propeller and its pitch setting. If there is no pilot's operating handbook for the particular airframe/engine/propeller configuration, then the pilot must calculate the performance speeds by trial and measurement. Critical limiting speeds • Va — design manoeuvring speed. Design rules state that the minimum acceptable design manoeuvring speed is a fixed calculation relative to Vs1 for all aircraft within the same category. For a 'normal' category light aircraft (whose certificated load limit factor in the pitching plane is +3.8g), minimum Va = Ö3.8 Vs1, or 1.95 × Vs1. For a 'LSA' category aircraft (whose certificated vertical load limit factor is +4g), minimum Va = Ö4 Vs1, or 2 × Vs1. If the designer has opted for a design manoeuvring speed that is greater than the minimum acceptable speed then a Vo operating manoeuvring speed must also be specified. Va is also known as the 'optimum manoeuvre speed', or the 'corner speed', to military pilots as it's at the intersection of the structural limit load factor and the maximum aerodynamic force curve (the 'A' corner) in the aircraft's manoeuvring flight envelope, i.e. Va is the speed at which an aircraft can make the tightest possible turn (the minimum radius turn) and the fastest rate of turn by applying the aerodynamic limit (maximum aoa [CL max]) and the structural load limit simultaneously. (Of course, in the military context, in such a turn the aircraft would be comparatively low in kinetic energy.) In the sailplane context the symbol Vm is used for a manoeuvring speed which is the product of the square root of the design load limit factor and the minimum flight speed. Va is sometimes referred to as the 'speed for maximum control deflection' which has been the cause of much confusion. It is unwise to make full or abrupt applications of any one primary flight control if you are flying at a speed greater than Va, because at higher speeds it is easy to apply (see the stick force gradient) aerodynamic forces that could exceed the aircraft's structural limitations. But, even when flying below Va, it is unwise to make rapid control reversals or 'checks' such as alternating heavy applications of rudder or suddenly apply heavy asymmetric loads, e.g. heavy application of elevator and rudder or aileron; see the flick roll. (That misleading term, 'speed for maximum control deflection', was subject to much debate in 2001 following the horrific crash of American Airlines Flight 587, an Airbus A300 which, shortly after take-off while in a climbing turn at an airspeed 20 knots below standard Va, ran into wake vortices from a Boeing 747 four miles ahead. To counter sideslip it appears the pilot flying employed four nearly full-rudder reversal movements within a seven-second period. Those pilot-commanded side forces induced a tail fin load twice the design load limit and 1.3 times the ultimate load limit, at which point the complete fin and rudder broke away. In 2010 the U.S. Federal Aviation Administation issued a 'Maneuvering Speed Limitation Statement' namely: (i) Full application of pitch, roll, or yaw controls should be confined to speeds below the maneuvering speed; (ii) Rapid and large alternating control inputs, especially in combination with large changes in pitch, roll, or yaw, and full control inputs in more than one axis at the same time, should be avoided as they may result in structural failures at any speed, including below the maneuvering speed. ) Va is usually not marked on the ASI but there should be a placard indicating the MTOW manoeuvring speed on the instrument panel near the ASI or in the Pilot Operating Handbook or Aircraft Flight Manual; if not available, you can assume it's twice maximum weight Vs1 for non-aerobatic light aircraft and reduces as aircraft inertia (i.e. weight or, more properly, mass) reduces and thus Vs1 decreases. Note: if a recreational pilot is foolish enough to operate an aircraft at a weight exceeding MTOW then the overloaded aircraft's stall speed will be higher; consequently Va in that condition will be higher. So Va is not a fixed documented value, it decreases as the aircraft's weight decreases from MTOW, because the effects of the atmospheric forces become more pronounced as its inertia decreases. Sometimes the aircraft's documentation will specify the Va for weights below MTOW but it may be left up to the pilot to calculate the Va for the current aircraft weight. Using rule of thumb #3 above, the reduction in Va will be half the percentage reduction in aircraft weight; for example if, with only the pilot on board, weight is 16% below MTOW then Va is reduced by 8%. Flying at speeds below that estimated Va in turbulent conditions also enhances the possibility of stalls induced by vertical gusts — and also may reduce aileron and rudder effectiveness, so the pilot in command must be careful to select an optimum speed for the atmospheric conditions. Also note that the documented Va is calculated for the aircraft in a clean configuration — it does not apply to flight with the flaps extended, see Vfe maximum flaps extended speed. Misuse of controls in light aircraft can generate structural loads greater than those encountered in turbulence, so Va is also useful as a 'turbulent air operating speed' and most recreational aircraft operating handbooks recommend that airspeed be reduced to Va in turbulent conditions. When flying above this speed, gust-induced loads can exceed the design limit of many structures within the aircraft, including the pilot's seat and the engine mount, possibly even the crankshaft. Gust loads in the high temperature conditions of the Australian tropical continental air mass can be extremely high. Va is the recommended indicated cruising speed (CAS) when flying in moderate turbulence — intermittent, uncomfortable jolts. At this compromise speed, the aircraft will generally produce an accelerated stall and thus alleviate the aerodynamic force (including any manoeuvring forces) on the wings and other structures, if it encounters a vertical current that imparts an acceleration sufficient to exceed the load limit factor. Read 'The speed to fly in turbulence', in the 'Decreasing your exposure to risk' guide. • Vo — operating manoeuvring speed. If the aircraft designer has specified a design manoeuvring speed that is greater than the regulatory minimum (Ön × Vs1 where 'n' is the category limit load factor) then, when flying at Va and if a substantial nose-up pitching manoeuvre is applied, the aircraft may exceed the limit load factor before stalling. So, an operating manoeuvring speed Vo should also be established as an operating limitation speed, which is a selected speed that is not greater than Ön × Vs1 and is a speed where the aircraft will stall in a nose-up pitching manoeuvre before exceeding the structural load limits. Thus Va must be equal to or greater than Ön × Vs1 while Vo must be equal to or less than Ön × Vs1. The load limit factor is 3.8g for normal category sport and recreational aeroplanes and 4g for the LSA category. The square roots of 3.8 and 4 are very close — 1.95 and 2 respectively — so we can rephrase the preceding statement as 'Va must be equal to, or greater than, twice Vs1 while Vo must be equal to, or less than, twice Vs1. Remember that Vs1 stall speed reduces when aircraft weight is less than MTOW so the appropriate Va indicated air speed will decrease in proportion to the decrease in aircraft weight. Flying at speeds much below Va in turbulent conditions also enhances the possibility of stalls induced by vertical gusts — and also may reduce aileron and rudder effectiveness. • Vb — design speed for maximum gust intensity. The applicable vertical gust intensities range from 25 fps (7.5 m/s) to 50 fps (15 m/s). Also known as the maximum rough air speed. It is not required to be specified for normal, utility and LSA aeroplanes (in those categories Vb would generally only differ by a few knots from Va). Vb is specified in the European Joint Airworthiness Requirements JAR-22 for sailplanes and powered sailplanes in the utility and acrobatic categories but in this case Vb is the speed at which the sailplane is able to withstand a strong vertical gust of 50 fps (15 m/s or 30 knots) without exceeding the load limit factor, i.e. it is the speed at which an encounter with a gust of the specified value produces CL max. • Vfe — maximum flaps extended speed. It is indicated by the top end of the ASI white arc. Flight with flaps extended — or extending flaps — above this speed may result in distortion of the flaps or their supporting structure and extension mechanism. Various Vfe speeds may be specified according to the available flap settings. Generally speaking, the flight load limit factor is reduced by about 50% when flaps are fully extended. For example, the aircraft flight manual of a 'normal' category light aircraft will probably note that the load limit factor is reduced from 3.8g to 2g. So, extending some flap in turbulent conditions will decrease the stall speed but will reduce the load limit factor; thus it's very much a 'pilot-in-command' decision of 'when' and 'how much' to use, but certainly full flap is most unlikely in any condition. • Vno — maximum structural cruise speed or 'normal operating limit', indicated by the top end of the ASI green arc. Flight above Vno should only be conducted cautiously and in smooth air, while the pilot should not apply any abnormal control inputs when cruising at, or above, Vno. Vno must be equal to or greater than Vc (below, in section 'Cruise speeds'), but in most light aircraft Vno and Vc are assumed synonymous. When cruising at, or below, Vno, the aircraft should not be damaged by a 30 feet/second vertical gust — which is at the bottom end of the moderate to strong vertical gust scale of 25–50 feet/second vertical gusts; read 'The speed to fly in turbulence'. • Vne — never exceed speed, which is the IAS that should never be intentionally exceeded in a dive, or other manoeuvre in smooth air. FAR 23 requires that Vne be not more than 90% of the design diving speed Vd or the flight-demonstrated diving speed Vdf. Vd and Vdf are not included in pilot operating documentation — they are the realm of the test pilot. Vne is indicated by the red line at the top end of the ASI yellow arc. For light aircraft operating below 10 000 feet, it can usually be assumed that Vne is a fixed IAS. If aircraft have high altitude capability or particular airframe vibration characteristics, it is possible that the designer will specify Vne as a TAS, above a particular altitude and for various altitude bands of perhaps 3000 feet. If Vne varies with altitude, then FAR Part 23.1545 (c) requires a placard next to the ASI indicating the appropriate IAS limitations throughout the aircraft's operating altitude range. This particularly applies to sailplanes and powered sailplanes whose very high aspect ratio wings are candidates for flutter problems and such low drag aircraft can build up airspeed at altitude very quickly in quite shallow dives. For expanded information see 'Don't fly real fast' in the 'Decreasing your exposure to risk' guide. • Vs1 (sometimes incorrectly shown as Vsi) — stalling speed, or the minimum steady flight speed, in a specified flight configuration. For a simple aircraft, Vs1 is normally measured in level flight with flaps up, at MTOW and 1g wing loading, with engine idling following a gradual deceleration (one knot per second) — accompanied by increasing rearward movement of the control column — to that minimum flight speed. It is indicated by the bottom end of the ASI green arc, but it should be documented as both IAS and CAS; if CAS is not mentioned the quoted stall speed is probably inaccurate. Vs1 decreases as the aircraft weight decreases from MTOW, which also means that if the pilot can reduce the wing loading below 1g — by an 'unloading' manoeuvre — Vs1 is decreased. Stalling speed under a 2g wing loading, for instance, might be referred to as Vs2g. • Vso — stalling speed, or the minimum steady flight speed, in the landing configuration of flaps down and engine at low or idle power as it would be just prior to touchdown. This is measured using the same method as Vs1 but with the cg at the most extreme position allowed — usually the most forward position where backward movement of the control column may be limited. It is indicated by the bottom end of the ASI white arc.In the documentation both IAS and CAS should be shown. Like Vs1, Vso decreases as the aircraft weight decreases from MTOW. The designation Vs is used as a general reference to the design stall speed. • Vmin — minimum airspeed. Vs is generally specified in powered, rigid-wing recreational aircraft as the minimum speed but for other aircraft categories a 'Vmin' may be specified instead. For example for gyroplanes Vmin is the minimum controllable level flight airspeed below which there is insufficient power available to maintain altitude. For paragliders it is the minimum speed, within the wing's available trimmer range, below which the parawing loses its lift. Cruise speeds A cruising aircraft is normally flying at a moderate, fuel efficient speed and maintaining the appropriate cruising altitude. The Australian Civil Aviation Regulations hold this definition: "cruise phase of flight" means the part of an aircraft's flight: (a) that starts when the aircraft reaches its first planned cruise level, ... and (b) that ends when the aircraft reaches the point at which the aircraft first starts its descent for the purpose of landing; and includes flight level changes made during that part of the flight. • Vbr — best range, or Vmd — minimum drag, is the speed that provides maximum L/D by producing minimum drag and thus the best power-to-speed ratio. This speed might utilise about 55% power and is usually flown at the lowest altitude where the throttle is fully open to obtain that speed. Vbr/Vmd decreases as the aircraft weight decreases from MTOW. It's rather boring to fly at that speed, wind conditions have to be taken into account, and the fuel saving may not be that significant compared to flying at a speed 10% faster. Also, the engine manufacturer's operating recommendations should be followed, but mixture is usually leaned, and minimum rpm set if a constant speed propeller is fitted. Vbr/Vmd has the same basic airspeed range as Vy and Vbg [below]. There is a difference in concept between Vbr and Vmd. Pilots of low-powered aircraft are generally not interested in the best power to airspeed ratio in cruise; ground speed achieved per litre is far more significant, so in some conditions Vbr equals Vmd but in headwind conditions Vbr is increased. Look at the diagram from section 1.7 at left and note the pink line that has been drawn from the junction of the vertical and horizontal axes tangential to the power required curve. That line just touches the curve at a position corresponding to the minimum drag airspeed Vmd. Now imagine a 30 knot headwind and start the tangential line from a point along the horizontal axis that is equivalent to 30 knots; that (the blue line) will be tangent to the power required curve at a position corresponding to a higher speed — Vbr for a 30 knot headwind. The rule of thumb is to add half the head wind to the basic Vbr, which, in this case, indicates a Vbr that is about 15 knots greater than Vmd. This is the same principle used by sailplane pilots to establish their best penetration speed — see the speed polar curves for optimum glide speed in the 'Coping with emergencies guide'. • Vbe — best endurance, or Vmp — minimum power, is the CAS that gives the greatest airborne time per litre (i.e. least fuel flow per hour and, of course, power is proportional to fuel flow), possibly around 80% of Vbr/Vmd, and decreases as the aircraft weight decreases from MTOW. Flight at lowest safe altitude provides best engine performance. Might utilise about 45% power at MTOW. It is the speed for minimum power required for level flight, as shown in the power required curve above. Vbe/Vmp is the speed that might be used when flying a search pattern to allow a proper area survey, or when waiting for ground fog to disperse, but it is possibly uncomfortable to fly for long periods at such a low speed. Also the very low power setting may be inconsistent with good engine handling practice. Carburettor icing may be aggravated. The Vmp designation and speed is also used as a power-off glide speed, providing the best endurance — least rate of sink — in the glide; see 'Power-off descent speeds' below. Vbe/Vmp is in the same speed range as Vx — the best angle of climb airspeed. • Vc — the design cruising speed or the optimum cruise speed — the latter being the speed that gives the most velocity (i.e. greatest distance/time) from a litre of fuel, usually utilises 75% power at MTOW and is about 20–30% greater than the maximum L/D speed — Vbr. The speed and power required both decrease as the aircraft weight decreases from MTOW. Refer to rule of thumb #3 in section 2.8 'Stalling airspeeds'. For normal category aircraft, FAR Part 23 specifies a minimum design cruising speed (in knots) = 33 ÖW/S. For this calculation the wing loading W/S is expressed in pounds per square foot. Many minimum ultralights are unable to comply with the FAR Part 23 design requirement for a minimum design cruising speed. For most light aircraft, Vc is synonymous with Vno. FAR 23 Appendix A provides simplified design load criteria and allows designers of many conventional single-engine monoplanes weighing less than 2700 kg to take advantage of the simplification. That same appendix is generally duplicated in the design regulations of most other countries. One advantage is that it is not necessary to specify Vno; instead, Vc is designated in the flight manual as the maximum structural cruise speed (i.e. Vno = Vc) and that Vc may be set at 90% of Vh. • Vh — the maximum level flight indicated speed (CAS) attainable at sea-level, utilising maximum continuous engine power. For most engines maximum continuous engine power at sea-level will be less than full throttle power. Take-off and landing speeds • Vle — for retractable undercarriage aircraft — the maximum indicated speed at which the landing gear can remain extended without risking gear door damage. • Vlo — the maximum indicated speed at which the landing gear system can be operated. Vle and Vlo are unlikely to be applicable to most ultralights. • Vlof — the lift-off indicated speed for normal take-off. Vlof is about 10% above Vmu. • Vmu — minimum unstick speed. This is an indicated speed used in take-off conditions where it is advisable to lift off at the lowest possible airspeed to get the tyres off the surface (e.g. soft field or wet grass ) and safely fly in ground effect until a Vtoss is attained to allow climb-out. Acceleration after lift-off at Vmu is slow, due to the drag at the high aoa, and should not be used as an obstacle clearance technique. • Vref — the threshold speed or the reference indicated approach speed. Usually about 1.3 to 1.5 times Vso plus 50% of the wind gust speed in excess of the mean wind speed; e.g. Vso = 30 knots, wind speed 10 knots gusting to 20 knots, Vref = 1.3 x 30 + 5 knots = 44 knots. Faster, heavier aircraft would tend towards the 1.3 times Vso end; lighter, slower aircraft would tend towards the 1.5 times Vso end. Normal landing procedure is to set up the approach so that an imaginary 15 metre (50 ft) high screen placed before the runway threshold is crossed at Vref and the airspeed is reduced to maybe 1.2 to 1.3 × Vso — plus the gust allowance — when rounding out prior to touchdown. The ground distance from the screen to the touch-down point can be roughly estimated, using the 1-in-60 rule, from the approach slope. For example, with a 6° slope — which is around the norm for most light 3-axis aircraft — the distance will be 60/6 × 15 = 150 m. To this must be added any float period plus the ground roll distance with normal braking, to give the total landing distance over the standard 15 m screen — in nil wind conditions. • Vtoss — minimum take-off safety speed. This is an indicated speed chosen to ensure that adequate control will still exist during initial climb after lift-off if power is lost or turbulence encountered. After lift-off, the aircraft should be held down and not allowed to climb away until Vtoss is attained. CAO 101.28, an airworthiness certification requirement for commercially supplied amateur-built kit ultralights, states in part: "The take-off distance shall be established and shall be the distance required to reach a screen height of 50 feet from a standing start, with ... short, dry grass surface ... the aeroplane reaching the screen height at a take-off safety speed not less than 1.2 Vs1 ... take-off charts ... shall schedule distances established in accordance with the provisions of this paragraph, factored by 1.15." Sea-level ISA and nil wind conditions are implied. CAO 95.55 has much the same wording but specifies 1.3 Vs1 as the take-off safety speed. (Similarly, CAO 101.28 states that the landing distance will be that to come to a full stop from a screen height of 50 feet, with the screen being crossed at 1.3 Vso and the same conditions as specified for the take-off distance.) In normal take-off conditions Vtoss should be somewhere between 1.3 and 1.5 times Vs1, with 'draggy' aircraft tending to the higher value. If power is lost in the initial climb, a draggy aircraft will lose airspeed very rapidly and take some time to regain it even though the pilot reacts quickly and pushes the control column forward. See 'Engine failure after take-off'. There is a similar code used for multi-engine aircraft — Vtos — which refers to the minimum speed for climb-out with one engine inoperative. Climb speeds • Vx — indicated speed provides best angle of climb for obstacle clearance; i.e. to attain height over the shortest ground distance using maximum thrust available. This is probably better described as the precautionary climb speed — the initial climb speed used when there are obstructions off the end of a marginal airstrip or when climbing out of an obstructed valley. Vx decreases as the aircraft weight decreases from MTOW (refer rule of thumb #3 above), but the angle of attack is maintained at around 8–10º with very high induced drag. It is the climb airspeed where the ratio of vertical speed to horizontal (ground) speed is the highest. Vx may be less than or equal to Vtoss. The aircraft's power-to-weight ratio (i.e. excess power) and L/D ratio affect the angle of climb at the designated airspeed. However, be aware that the angle of climb will also depend on the low-level wind conditions at the airfield. In a headwind, the climb angle is increased and reduced in a tailwind. Also note that aoa during climb may be only 5 or 6° below the critical aoa, thus care must be taken not to induce a 'departure stall', particularly in turbulent conditions. And remember that Vs1 increases in a turn, so that the small safety gap between Vx and Vs1 will be eroded if a climbing turn is attempted; see 'Safety: loss of control in low level turns'. Climbing at Vx should always be regarded as a short-term precautionary procedure, and once clear of obstacles, airspeed should be increased to Vy — or any appropriate 'enroute climb speed'. The latter reduces the rate of climb but has the benefit of reducing total sector time, increasing forward visibility and increasing engine cooling — which may be beneficial to engine operation but, more importantly, provides a little more airspeed in hand should the engine falter or fail. The airspeed for Vx increases with (density) altitude and is much the same airspeed as Vbe, although engine cooling needs might require a higher airspeed. • Vy — indicated speed for best rate of climb. This speed is used to attain height in the shortest time using maximum power, or possibly maximum continuous climb power. Vy decreases as the aircraft weight decreases from MTOW (refer to rule of thumb #3 above), but the angle of attack is maintained at around 6–8º. After reaching a safe height airspeed may be increased to an appropriate enroute climb speed. The CAS for Vy decreases with (density) altitude — i.e. as TAS increases — and also is usually fairly close to the maximum L/D speed Vbr, taking engine cooling flows into account. Vx and Vy converge as (density) altitude increases. Power-off descent speeds • Vbg — best power-off glide This is the airspeed that provides minimum drag thus maximum L/D, or glide ratio, and thus the greatest still air glide range from the potential energy of height. It is much the same basic airspeed as Vbr/Vmd and Vy, though it may be a bit lower and decreases as the aircraft weight decreases from MTOW. However, like Vbr, wind direction and speed have to be taken into account before you can choose the Vbg speed when in a forced glide; for more information on the power-off glide speeds read the 'Know the best glide and minimum descent airspeeds' and 'Know the practical glide ratio and terrain footprint' sections in the 'Coping with emergencies guide'. In lower wind conditions, Vbg is increased in a headwind by around one quarter of the windspeed, but is decreased in a tailwind by a similar amount. In higher wind conditions, say above 25 knots, the speed changes required would be around one half of the windspeed. • Vmp — minimum power. This is the speed that results in the lowest rate of sink in a power-off glide, and provides the longest duration of flight from the potential energy of height. The lowest rate of sink occurs at the minimum value of drag × velocity. It is probably around 80–85% of Vbg, and may be a similar speed to Vbe and Vx. Vbg for an average sailplane with a wing loading of 32 kg/m² could be 50 knots, providing a glide ratio of 38:1, while Vmp would be 41 knots providing a sink rate of 0.6 m/s or 120 feet/minute. If you want further explanation of sink rates, etc. (with excellent diagrams) read this article on glider performance airspeeds. (Note: the term Vmd meaning minimum descent, rather than minimum drag, is in common usage to designate the speed for lowest rate of sink in a power-off glide.) Both Vbg distance and Vmp time are adversely affected by the extra drag of a windmilling propeller, which creates more drag than a stopped (but unfeathered) propeller following engine shut-down or failure. A windmilling propeller has a negative aoa and the 'thrust' direction is reversed, in effect adding to drag. Something similar might happen with some engine/propeller configurations, when simulating a glide at the specified Vbg/Vmp speed with the throttle closed but the engine still firing; the propeller drag might increase the rate of sink beyond that expected, and perhaps lead to the erroneous conclusion that the best glide speeds in the handbook are understated. 3.3.10 The design manoeuvring flight envelope The structural design manoeuvring flight envelope of a recreational aircraft describes its structural strength limitations and its maximum aerodynamic capabilities. The various envelopes have been described as "the parameters within which an aircraft can be safely operated, with average pilot ability, at varying density altitudes, airframe states, power outputs, wing loadings and atmospheric turbulence". 'Airframe states' refer to flap and spoiler extensions, undercarriage position, the gross weight and the fore-and-aft position of the centre of gravity. The flight envelope is only relevant for an aircraft within the required weight and balance conditions. The boundary of the envelope shown below is formed by combinations of the applicable limiting positive and negative load factors and dynamic pressures (indicated airspeeds). It is a two-dimensional model that has indicated airspeed (i.e. CAS) along the horizontal axis and flight load factors expressed in 'g' accelerations along the vertical. The loads are those parallel to the aircraft's normal axis, i.e. perpendicular to the longitudinal axis — the aerodynamic loads in the aircraft's pitching plane. The symbol 'n' is generally used to identify such loads. The parameters for a light aircraft usually are the limiting critical airspeeds — Vs, Va and Vne and the certificated limit load factors. There are other flight limitations which are not displayed in this flight envelope diagram, e.g. an angle of bank limitation of 60° for some aircraft categories. For weight-shift aircraft in particular, there are also pitch limitations; — e.g. 45° nose up or nose down from the horizontal. The manufacturers of high performance non-recreational aircraft would also provide other charts, altitude performance or turning performance for example. The V-n [or V-g] diagram below is a simplified representation of a few aspects of the manoeuvring flight envelope for an LSA category aircraft at MTOW and low altitudes. An indicated (CAS) airspeed scale would normally be displayed along the horizontal axis and load factors (in units of 'g') along the vertical axis, between the certificated load limits for light sport aircraft of +4g to –2g. This diagram does not reflect any flaps-extended conditions. The positive and negative 'aircraft normal force coefficient curves'* are for the aircraft as a whole but can be assumed to approximate the accelerated stall speeds at loads of Vs1g × Öload factor. (*Normal force: pilots consider the aerodynamic force acting on the aircraft in terms of lift and drag, lift being perpendicular to the relative free-stream airflow and drag being parallel with it. Aerodynamicists may also consider the total aerodynamic force in terms of a 'normal force' which is parallel to the aircraft's normal axis and an 'axial force' which is parallel to the longitudinal axis plus a 'side force' parallel to the lateral axis. The symbol for the aircraft normal force coefficient is Cna, however, the stated aircraft limit load factor (e.g. 3g or 4g) also applies to axial and side forces, not just the normal force.) The stall speed at a 4g load limit factor would be Vs1g × Ö4 = Vs1g × 2, thus if the Vs1 stall speed was 45 knots then the stall speed where the positive curve intersects the 4g load limit factor line is 90 knots, i.e. that speed is the lowest possible speed at which the pilot can pull maximum g, i.e. 4g. That corner of the envelope is usually the position of Va — the design manoeuvring speed. You can see from the curve that at the Va airspeed the aircraft will stall when the wing loading exceeds 4g. Sustained flight is not possible in the white region to the left of the accelerated stall curves because the wings will be stalled. (Note: the light blue area between +1g and –1g is the realm of reduced gravity, or microgravity. NASA and other organisations use C135 and DC-9 aircraft flying a parabolic trajectory to produce reduced or near-zero gravity conditions, for the aircraft occupants, for periods of 20–30 seconds. A light aircraft can be flown in that area for a brief period by 'unloading' the wings — 'bunting'.) Except for transient turbulence loads the negative flight envelope below the 0g line mainly relates to aerobatic aircraft. (Note: in section 2.8 we determined that a 60° banked level turn doubled the normal wing load. With Vs1 at 45 knots and Va 90 knots then visualise a horizontal line from the 2g point; the interception with the curve will equate with about 60 knots. So that would be the lowest possible speed for a 60° banked level turn.) The white areas above and below the red lines represent structural loads beyond the positive and negative limit loads. Flight loads caused by control misuse and/or atmospheric turbulence that exceed +4g or –2g may cause temporary pilot incapacitation (greyout/blackout/redout) and airframe distortion. Flight loads 50% greater than +4g or –2g (i.e. +6g or –3g) will very likely cause airframe breakup. In the aircraft design process the design maximum dive speed Vd is a calculated speed, but in the flight test stage the aircraft may be tested up to a speed where it still demonstrates no flutter, or other, problems. This is the flight-demonstrated dive speed Vdf which is lower than the design Vd but, possibly, it could be equal to it. The dynamic pressure that a pilot must not exceed is represented by the Vne airspeed limit, and that is required to be no more than 90% of Vd or Vdf. At Vne the aircraft is flying at a very small angle of attack, deriving most of the aerodynamic force from the dynamic pressure. If the pilot — or turbulence — suddenly increases the aoa the consequent increase in the lift coefficient CL (amplified by the aircraft's inertia momentarily maintaining the original flight path) could place an extreme load on the airframe, enough to break it. See 'Wind shear and turbulence'. Some manoeuvring flight envelopes might have the top right corner cut off, from the Vno line intersection with the limit load factor line, to some less-than-maximum load factor along the Vne line. For more information concerning the risks of flight at excessive speed read 'Don't fly real fast!' in the 'Decreasing your exposure to risk' tutorial. Vne is the maximum airspeed, but full and rapid control applications are restricted to speeds at or below Va. Vno is the maximum structural cruise speed or 'normal operating limit' for flight in light to medium turbulence. Above the Vno/Vc speed flight should only be conducted cautiously and in smooth air. So, the aircraft can be flown in the light green area without limits on smooth control use and it can be operated within the olive-green area in light to moderate turbulence, but it should not be operated in the yellow area except in a reasonably smooth atmosphere. If it is inadvertently operated in the area outside the certificated load limits, or at velocities greater than Vne, structural distortion then failure may result. The more the wings are loaded while the aircraft is operating in the region above Vne, the greater the possibility of structural failure. The potential exists to exceed both Vd and maximum load in the pullout from a spiral dive. Vertical gusts impose loads on the wing structure by inducing rapid, but momentary, changes in aoa with consequent changes in the aerodynamic forces. The faster the aircraft is moving, the greater the gust-induced load. FAR Part 23 has requirements for designers to consider unexpected gust loads. The resulting gust envelope is often represented as the flight manoeuvring envelope with overlaid gust lines. Vb is developed by the aircraft designer as a recommended turbulence penetration speed in severe turbulence, with varying vertical gust components — up to 50 feet/second considered for a light aircraft at cruise speed. However, Vb is not specified for most light aircraft because, for such aircraft, there is probably not much difference between Va and Vb. The flight envelope is considerably reduced if asymmetric manoeuvring loads are applied to the airframe. Such loads might be applied by an aircraft yawing (side force) or rolling (lateral force) while recovering (normal force) from a high-speed descent. The same applies to the use of flaps. There are other attributes that define the envelope – resistance to spin and spin recovery, for example. Note that the term 'average pilot ability' doesn't imply that those who consider themselves 'above average' can push the envelope without losing control or stressing the airframe. There is more information on the flight envelope in the safety brief document 'Don't fly real fast'. Things that are handy to know • Absolute temperature is expressed in kelvins [K], one K equals 1 °C. The base temperature is zero kelvin — equivalent to minus 273 °C — so 0 °C is equivalent to 273 K. • In a free stream airflow, a favourable pressure gradient is one where static pressure decreases with distance downstream. An adverse pressure gradient is one where static pressure increases with distance downstream. • ASI position error. The static vent is an opening, best placed at a position on the aircraft's fuselage, where atmospheric static pressure is not influenced by the shape of the fuselage or other aerodynamic disturbances. (Some aircraft may be fitted with a static vent on each side of the fuselage to counteract static pressure disturbances caused when the aircraft is slipping/skidding, and/or a switchable alternative static source within the cockpit.) The opening is a tube connected to the cockpit and supplies the ambient atmospheric pressure, or static pressure, to the three pressure sensing instruments — ASI, VSI and altimeter. The static vent is usually subject to some pressure disturbances at particular aircraft attitudes, as is the pitot tube, but probably to a lesser degree. In addition if the airflow is not squarely aligned with the entry of the pitot head there will be a reduction in the indicated airspeed which increases as aoa increases. These disturbances result in position error: for a wing-mounted vent, the ASI may underread by 10 knots at stalling aoa. In a sideslip, a single fuselage-mounted static vent may be subject to dynamic pressure and ASI and VSI readings will consequently be completely misleading. Also, the instrument movements will have inbuilt errors, usually caused by excessive friction. Obstructions in the tubes — such as water or wasp's nests — will cause misreadings or no reading. Position error corrections plus the instrument error corrections for the system should be noted in the Pilot's Operating Handbook and placarded on the instrument panel. The IAS corrected for instrument and position errors is called the calibrated airspeed [CAS]. Either CAS or IAS may be the reference speed in the Pilot's Operating Handbook for aircraft operations, but if the position error corrections are not shown then the ASI system has not been assessed for accuracy. In some poor ASI installations, IAS may be 20% less than CAS at low speeds, but they are usually much the same at normal cruising speeds. Regulations for type-certificated aircraft require that the complete airspeed indicating system of pitot head, static vent, connecting tubes and instrument be tuned so that the IAS reading is within 3% of the true reading over the normal airspeed range from Vs to Vc. However, you should suspect that any non-certificated ultralight ASI system will be inaccurate at all speeds, and particularly so at high aoa. When comparing published stall speeds between different aircraft types, it is wise to determine CAS, as published IAS stall speeds may be downright misleading. • Compressibility effects. The compressibility of air within the pitot tube has little effect on the accuracy of the ASI reading for aircraft operating below 10 000 feet and 200 knots; at an airspeed of 200 knots, compressibility will cause CAS to overread by only 0.5 knots or so. However, for aircraft operating at high speed or high altitude, compressibility will cause the ASI to overread significantly, so there is a need to correct CAS using a compressibility correction chart. The correction value is deducted from CAS to give the compressibility corrected CAS — otherwise known as equivalent airspeed [EAS]. For most medium-speed aircraft, it is probable that the compressibility correction value has been built into the IAS–CAS airspeed correction table. There is no practical application for recreational pilots, but aerodynamicists use the EAS term — rather than IAS or CAS — assuming an ASI, that has no errors caused by mechanical, position, aoa or compressibility effects, would display the ISA standard condition sea-level true airspeed, which is equivalent to the dynamic pressure in the instrument at any altitude. For more information see 'Notes: compressibility of airflow and Mach number'. • Checking validity of claimed stall speeds. There is a simple method to check the validity of published stall speeds. Practically all very light aircraft (except those with single surface wings like the Wheeler Scout or weight-shift aircraft) use simple, long proven, standard camber aerofoils to form the wings. The lift coefficient attainable at maximum aoa with such wings without flaps is about 1.2 or 1.3 for faster-cruising aircraft, and 1.5 or 1.6 for the slower, higher-lift sections. If equipped with flaps over, say, half the trailing edge, then CLmax might be increased by 0.5 when the flaps are extended to at least 35°. When other high-lift devices (for example, full length leading edge slats/slots) are added to the wing, then CLmax might increase 0.6. Thus, a specialised short take-off and landing aircraft fitted with a high-lift aerofoil, full-length leading edge slats and large extended flaps would have a CLmax of (at least) 1.6 + 0.5 + 0.6 = 2.7. The lift equation at normal stall speed is: Lift = CLmax × ½rV² × S = weight or re-arranged: CLmax = weight / (½rV² × S) We can use that equation to check the validity of stall speed claims if we know the maximum take-off weight [MTOW] and the wing area . Let's say a supplier claims that an aircraft, lacking any high-lift devices, has a stall speed of 30 knots. The MTOW is 450 kg and the wing area is 12 m². In the equation, the weight must be expressed in newtons — so multiply kg × 10 = 4500 N; and the stall speed must be expressed in metres per second — so just halve the velocity in knots = 15 m/s: the air density used must be the ISA msl density = 1.225 kg/m³. Thus CLmax = 4500 / (0.5 × 1.225 × 15 × 15 × 12) = 2.7 A lift coefficient of 2.7 is very much higher than that achievable without high-lift devices, so you would conclude that the claimed stall speed is nonsense; a figure of 38 knots is probably closer to the mark. • Estimating stall speeds. Conversely you can do a rough approximation of stall speeds using the following simplified formulae if you know the wing loading in kilograms per square metre or in pounds per square foot, and can estimate CLmax with flaps stowed or fully extended. Stall speed [knots] = 7.8 × square root (wing loading in kg/m² divided by CLmax) (or) Stall speed [knots] = 17.2 × square root (wing loading in lb/ft² divided by CLmax) Using our previous example of a lightly-loaded Jabiru with a mass of 340 kg (748 lb), wing area of 7.9 m² (85 ft²) thus wing loading = 43 kg/m² (8.8 lb/ft²) and estimating CLmax with flaps fully extended as 2.0 then: estimated stall speed = 7.8 × square root (43/2) = 7.8 × 4.64 = 36 knots or estimated stall speed = 17.2 × square root (8.8/2) = 17.2 × 2.1 = 36 knots Stuff you don't need to know • The tropopause marks the boundary between the two lower layers of the atmosphere — the troposphere, and above it, the stratosphere. The height of the tropopause varies daily, seasonally, and latitudinally — it is about 28 000 feet at the poles and perhaps 55 000 feet at the equator. The significant difference between the troposphere and the stratosphere is that air temperature decreases steadily with height in the troposphere, but initially remains constant then increases steadily with height in the stratosphere, until the stratopause at about 50 km. The stratosphere contains very little water vapour and is much more stable than the troposphere. The ozone layer is within the stratosphere. • Boyle's law: at a constant temperature, the volume (V) of a given mass of gas is inversely proportional to the pressure (P) upon the gas; i.e. PV = constant. • The pressure law: at a constant volume, the pressure is directly proportional to temperature (T) in kelvins. • Charles' law: at a constant pressure, gases expand by about 1/273 of their volume, at 273 K, for each one kelvin rise in temperature; i.e. the volume of a given mass of gas at constant pressure is directly proportional to the absolute temperature. • For one mole of gas, the preceding laws are combined in the gas equation PV = RT, where R = the gas constant = 2.87 when P is expressed in hectopascals. Ordinary gases do not behave exactly in accordance with the gas laws. • The change in altitude for each one hPa change in pressure can be roughly calculated from the absolute temperature and the pressure at the level using the equation:=96T/P feet. • The term 'burble' also refers to the atmospheric wake of an object. Skydivers refer to their wake as 'the burble' while the disturbed airflow and exhaust gases behind a the island structure of a fast-moving aircraft carrier was (and probably still is) known to pilots as 'the burble'. STRICT COPYRIGHT JOHN BRANDON AND RECREATIONAL FLYING (.com)
 -
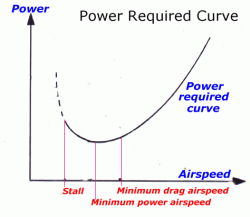 3.2.1 Cruise performance Cruise speed options When an aircraft is cruising, flying from point A to point B, the pilot has several options for setting cruise speed: One choice might be to get there as soon as possible, in which case the pilot would operate the engine at the maximum continuous power allowed by the engine designer. The recommended maximum continuous power is usually around 75% of the rated power of the engine and provides performance cruise. Another choice might be to get there using as little fuel as possible but in a reasonable time, in which case the pilot might choose a 55% power setting to provide an economy cruise airspeed. Or the pilot might choose any power setting, in the usual engine design range, between 55% and 75%; refer to cruise speeds in the 'Airspeed and properties of air' module. The power required curve In level flight at constant speed thrust power is required to balance induced and parasite drag. Power is the rate of doing work, so power (in watts) is force (newtons) × distance (metres) / time (seconds). Distance/time is speed so power required is drag force (N) × aircraft speed (m/s). Thus, if we use the expression for total drag from section 1.6 and multiply it by V we get: (Equation #1.3) Power required for level flight [watts] = CD × ½rV³ × S (note V cubed). The total drag curve can be converted into a 'power required' diagram — usually called the power curve — if you know the total drag at each airspeed between the minimum controllable speed and the maximum level flight speed. It is a different curve from that for total drag, because the power required is proportional to speed cubed rather than speed squared. This means that (ignoring the related CD change) if speed is doubled, drag is increased four-fold but power must be increased eight times — which indicates why increasing power output from, say, 75% power to full rated power, while holding level flight, doesn't provide a corresponding increase in airspeed. The diagram above is a typical level-flight power curve for a light aircraft. The part of the curve to the left of the minimum power airspeed is known as the back of the power curve — where the slower you want to fly, the more power is needed, because of induced drag at a high angle of attack. The lowest possible speed for controlled flight is the stall speed, which is discussed in the 'Airspeed and properties of air' module. Two aerodynamic cruise speeds are indicated — the speed associated with minimum drag (the point on the curve where the drag force factor has the lowest value) and the speed associated with minimum power (the point on the curve where drag force × speed has the lowest value). To maintain level flight at speeds less than or greater than the minimum power airspeed, power must be increased. Power available The engine provides power to the propeller. The propellers used in most light aircraft have a maximum efficiency factor, in the conversion of engine power to thrust power, of no more than 80%. (Thrust power = thrust × forward speed.) The pitch of the blades, the speed of rotation of the propeller and the forward speed of the aircraft all establish the angle of attack of the blades and the thrust delivered. The in-flight pitch of ultralight and light aircraft propeller blades is usually fixed (though many such types are adjustable on the ground) so that the maximum efficiency will occur at one combination of rpm and forward speed — this is usually in the mid-range between best rate of climb and the performance cruise airspeeds. Propeller blades are sometimes pitched to give the best efficiency near the best rate of climb speed (climb prop), or pitched for best efficiency at the performance cruise airspeed (cruise prop). The efficiency of all types of propellers falls off either side of the optimum; one with a too high pitch angle may have a very poor take-off performance, while one with a too low pitch may allow the engine to overspeed at any time. With the advent of higher-powered four-stroke light engines, such as the Jabiru 3300, there has been a corresponding increase in the availability of more advanced light-weight propeller systems, providing maximum effective power utilisation during all stages of flight. For more information refer to the 'Engine and propeller performance' module. Speed, power and altitude At sea-level, an aero-engine will deliver its rated power — provided it is in near-perfect ex-factory condition, properly warmed up and using fuel in appropriate condition. However, because air density decreases with increasing altitude, and an engine's performance depends on the weight of the charge delivered to the cylinders, then the full throttle power of a non-supercharged four-stroke engine will decrease with height. So, at about 6000–7000 feet above mean sea-level the maximum power available at full throttle may drop below 75% of rated power. At 12 000 feet full throttle power may be less than 55% of rated power. Thus, as altitude increases, the range of cruise power airspeeds decreases. For best engine performance, select a cruise altitude where the throttle is fully open and the engine is delivering 65% to 75% power. A couple of points to note from the speed-power diagram above: As air density, and consequently drag, decreases with height, then airspeed, from a particular power level, will increase with height; e.g. the airspeed attained with 65% power at sea-level is 90 knots increasing to 100 knots at 10 000 feet. At sea-level, an increase in power from 75% to 100% only results in an increase in airspeed from 100 to 110 knots. This is the norm with most light aircraft — that last 33% power increase to rated power only provides a 10% increase in airspeed. Power required vs power available In the 'power available' diagram at left, power available curves have been added to the earlier 'power required' diagram. The dashed red curve indicates the rated power — that is, the full throttle engine power delivered to the propeller over the range of level flight speeds at sea-level. The upper green curve — maximum thrust power, is that engine power converted by the propeller after allowing for 80% maximum propeller efficiency. The lower green curve is the propeller thrust power available with the engine throttled back to 75% power at sea-level, or if flying at an altitude such that full throttle opening will only deliver 75% of rated power. The intersection of those power available curves with the power required curve indicates the maximum cruise speed in each condition. The region between the maximum thrust power curve and the power required (to maintain level flight) curve indicates the excess power available at various cruise speeds — this excess power is available for various manoeuvres if the throttle is fully opened. The simplest use would be a straight unaccelerated climb, in which case the maximum rate of climb would be achieved at the airspeed where the two curves are furthest apart. It can be seen that the best rate of climb speed is around the same airspeed as the minimum drag airspeed shown in the earlier powered required diagram. The rate of climb will decrease at any speed either side of the best rate of climb speed because the power available for climb decreases. The rate of climb (metres/second) = excess power available (watts)/aircraft weight (N). For example, lets assume the preceding diagram is representative of an aircraft fitted with a 100 hp engine, and at the best rate of climb speed the engine/propeller has 25 hp (18 600 watts) of excess thrust power available. The aircraft weight is 4000 N so the rate of climb = 18 600/4000 = 4.65 m/s. To convert metres/second to feet/minute, multiply by 200 = 930 feet/minute as the maximum rate of climb. One thing to bear in mind is that we have assumed the aircraft's aerodynamic shape — its configuration is constant. However if the aircraft is fitted with flaps, high lift devices or spoilers the pilot is able to change its configuration and consequently its performance. Thus performance is dependent on power, plus attitude (pitch, bank, sideslip and aoa) plus configuration. 3.2.2 Forces in a climb When cruising, the difference between the current power requirement and power available — the excess power — can be used to accelerate the aircraft or climb, to accelerate and climb, or perform any manoeuvre that requires additional power. For instance if the aircraft has potential power available and the pilot opens the throttle, the thrust will exceed drag and the pilot can utilise that extra thrust to accelerate to a higher speed while maintaining level flight. Alternatively the pilot can opt to maintain the existing speed but use the extra thrust to climb to a higher altitude. The rate of climb (altitude gained per minute) depends on the amount of available power utilised for climbing, which depends in part on the airspeed chosen for the climb. There are other choices than the best rate of climb speed available for the climb — for example, the best angle of climb speed (which is around the same as the speed for minimum power) or a combination enroute cruise/climb speed. The climb speed chosen depends on terrain, weather, cloud cover and other operating variables. If an aircraft is maintained in a continuous full-throttle climb, at the best rate of climb airspeed, the rate of climb will be highest at sea-level; it will decrease with altitude, as engine power decreases. The aircraft will eventually arrive at an altitude where there is no excess power available for climb, then all the available power is needed to balance the drag in level flight and there will be only one airspeed at which level flight can be maintained. Below this airspeed the aircraft will stall. This altitude is the aircraft's absolute ceiling. However, unless trying for an altitude record, there is no point in attempting to climb to the absolute ceiling so the aircraft's service ceiling should appear in the aircraft's performance specification. The service ceiling is the altitude at which the rate of climb falls below 100 feet per minute; this is generally considered the minimum useful rate of climb. This diagram of forces in a climb and the subsequent mathematical expressions, have been simplified, aligning the angle of climb with the line of thrust. In fact the line of thrust will usually be 4 to 10° greater than the climb angle. The climb angle (c) is the angle between the flight path and the horizontal plane. The relationships in the triangle of forces shown are: Lift = weight × cosine c Thrust = drag + (weight × sine c) In a constant climb the forces are again in equilibrium, but now thrust + lift = drag + weight. Probably the most surprising thing about the triangle of forces in a straight climb is that lift is less than weight. For example, let's put the Jabiru into a 10° climb with weight = 4000 N. (There is an abridged trig. table at the end of this page.) Then, Lift = W cos c = 4000 × 0.985 = 3940 N It is power that provides a continuous rate of climb, but momentum may also be used to temporarily provide energy for climbing; see 'Conserving aircraft energy' below. It is evident from the above that in a steady climb, the rate of climb (and descent) is controlled with power, and the airspeed and angle of climb is controlled with the attitude and particularly the included angle of attack. This is somewhat of a simplification, as the pilot employs both power and attitude in unison to achieve a particular angle and rate of climb or descent. The angle of attack in a climb is the pitch attitude minus the angle of climb being achieved plus the wing incidence. A very important consideration, particularly when manoeuvring at low level at normal speeds, is that the steeper the climb angle the more thrust is required to counter weight. For example, if you pulled the Jabiru up into a 30° 'zoom' climb the thrust required = drag + weight × sine 30° (= 0.5) so the engine has to provide sufficient thrust to pull up half the weight plus overcome the increased drag due to the increased aoa in the climb. Clearly, this is not possible, so the airspeed will fall off very rapidly and will lead to a dangerous situation if the pilot is slow in getting the nose down to an achievable attitude. Never be tempted to indulge in zoom climbs — they are killers at low levels. 3.2.3 Forces in a descent If an aircraft is cruising at, for instance, the maximum 75% power speed and the pilot reduces the throttle to 65% power, the drag now exceeds thrust and the pilot has two options — maintain height, allowing the excess drag to slow the aircraft to the level flight speed appropriate to 65% power; or maintain the existing speed and allow the aircraft to enter a steady descent or sink. The rate of sink (a negative rate of climb, or altitude lost per minute) depends on the difference between the 75% power required for level flight at that airspeed and the 65% power utilised. This sink rate will remain constant as long as the thrust plus weight, which are together acting forward and downward, are exactly balanced by the lift plus drag, which are together acting upward and rearward. At a constant airspeed, the sink rate and the angle of descent will vary if thrust is varied. For example, if the pilot increased thrust but maintained constant airspeed, the rate of sink will decrease — even becoming positive; i.e. a rate of climb. If the pilot pushed forward on the control column to a much steeper angle of descent, while maintaining the same throttle opening, the thrust plus weight resultant vector becomes greater, the aircraft accelerates with consequent increase in thrust power and the acceleration continues until the forces are again in equilibrium. Actually, it is difficult to hold a stable aircraft in such a fixed angle 'power dive' as the aircraft will want to climb — but an unstable aircraft might want to 'tuck under'; i.e. increase the angle of dive, even past the vertical. We discuss the need for stability in the 'Stability' module. When the pilot closes the throttle completely, there is no thrust, the aircraft enters a gliding descent and the forces are then as shown in the diagram on the left. In the case of descent at a constant rate, the weight is exactly balanced by the resultant force of lift and drag. From the dashed parallelogram of forces shown, it can be seen that the tangent of the angle of glide equals drag/lift. For example, assuming a glide angle of 10° (from the abridged trigonometrical table below, the tangent of 10° is 0.176), the ratio of drag/lift in this case is then 1:5.7 (1/0.176 =5.7). Conversely, we can say that the angle of glide depends on the ratio of lift/drag [L/D]. The higher that ratio is, then the smaller the glide angle and consequently the further the aircraft will glide from a given height. For example, to calculate the optimum glide angle for an aircraft with a L/D of 12:1. Drag/lift equals 1/12, thus tangent = 0.08 and, from the trigonometrical table, the glide angle = 5°. Although there is no thrust associated with the power-off glide, the power required curve is still relevant. The minimum drag airspeed shown in that diagram is roughly the airspeed for best glide angle and the speed for minimum power is roughly the airspeed for minimum rate of sink in a glide. This is examined further in the 'Airspeed and the properties of air' module. It may be useful to know that in a glide, lift = weight × cosine glide angle and drag = weight × sine glide angle. There is further information on glide angles and airspeeds in the lift/drag ratio section of module 4. 3.2.4 Turning forces Centripetal force When an aircraft turns in any plane, an additional force must be continuously applied to overcome inertia, particularly as an aircraft's normal tendency is to continue in a straight line. This is achieved by applying a force towards the centre of the curve or arc — the centripetal force — which is the product of the aircraft mass and the acceleration required. Remember that acceleration is the rate of change of velocity — either speed or direction, or both. The acceleration, as you know from driving a car through an S curve, depends on the speed at which the vehicle is moving around the arc and the radius of the turn. Slow speed and a sweeping turn involves very little acceleration. But high speed and holding a small radius involves high acceleration, with consequent high radial g or centripetal force and difficulty in holding the turn. Even when an aircraft enters a straight climb from cruising flight, there is a short transition period between the straight and level path and the straight and climbing path, during which the aircraft must follow a curved path — a partial turn in the vertical plane. An aircraft turning at a constant rate turn is continuously accelerating towards the centre of the turn. The acceleration towards the centre of the turn is V²/r m/s². The centripetal force required to produce the turn is m × V²/r newtons, where m is the aircraft mass in kilograms and r is the turn radius in metres. Note this is aircraft mass, not weight. Turn forces and bank angle The diagram below shows the relationships between centripetal force, weight, lift and bank angle. In a level turn, the vertical component of the lift (Lvc) balances the aircraft weight and the horizontal component of lift (Lhc) provides the centripetal force. (Note: in a right-angle triangle the tangent of an angle is the ratio of the side opposite the angle to that adjacent to the angle. Thus, the tangent of the bank angle is equal to the centripetal force [cf] divided by the weight — or tan ø = cf/W. Or, it can be expressed as tan ø = V²/gr . In the diagram, I have created a parallelogram of forces so that all horizontal lines represent the centripetal force or Lhc and all vertical lines represent the weight or Lvc.) Let's look at the Jabiru, of mass 400 kg, in a 250 m radius horizontal turn at a constant speed of 97 knots or 50 m/s: Centripetal acceleration = V² / r = 50 × 50 / 250 = 10 m/s² Centripetal force required = mass × V² / r = mass × 10 = 400 × 10 = 4000 N The centripetal force of 4000 N is provided by the horizontal component of the lift force produced by the wings when banked at an angle from the horizontal. The correct bank angle depends on the airspeed and radius; think about a motorbike taking a curve in the road. During the level turn, the lift force must also have a vertical component to balance the aircraft's weight, in this case it is also 4000 N. But the total required force is not the sum of 4000 N + 4000 N = 8000 N; it is less and we have to find the one — and only one — bank angle where Lvc is equal to the weight and Lhc is equal to the required centripetal force. What then will be the correct bank angle (ø) for a balanced turn? Well, we can calculate it easily if you have access to trigonometrical tables. If you haven't then refer to the abridged version below. So, in a level turn requiring 4000 N centripetal force with weight 4000 N, the tangent of the bank angle = cf/W = 4000/4000 = 1.0, and thus (from the table) the angle = 45°. Actually, the bank angle would be 45° for any aircraft of any weight moving at 97 knots in a turn radius of 250 metres — provided the aircraft can fly at that speed, of course. (Do the sums with an aircraft of mass 2500 kg, thus weight = 25 000 N.). Now, what total lift force will the wings need to provide in a level turn if the actual weight component (aircraft plus contents) is 4000 N and the radial component also 4000 N? Resultant total lift force = actual weight divided by the cosine of the bank angle or L = W / cos ø. Weight is 4000 N, cosine of 45° is 0.707 = 4000/0.707 = 5660 N. The load on the structure in the turn is 5660/4000 = 1.41 times normal, or 1.41g. Alternatively the 'load factor' = 1/cosine (bank angle); so, cosine 45° is 0.707 = 1/0.707 = 1.41g. Manoeuvring loads In aviation usage, the lowercase 'g' denotes the acceleration caused by the force of gravity. When an aircraft is airborne maintaining a constant velocity and altitude — the total lift produced equals the aircraft's weight and that lift force is expressed as being equivalent to a '1g' load. Similarly, when the aircraft is parked on the ground, the load on the aircraft wheels (its weight) is a 1g load. Any time an aircraft's velocity is changed, there are positive or negative acceleration forces applied to the aircraft and felt by its occupants. The resultant manoeuvring load is normally expressed in terms of g load, which is the ratio of all the aerodynamic forces experienced during the acceleration to the aerodynamic forces existing at the normal 1g level flight state. You will come across terms such as '2g turn' or 'pulling 2g'. What is being implied is that during a particular manoeuvre the lift force is doubled and a radial acceleration is applied to the airframe — for the Jabiru a 2g load = 400 kg × 20 m/s² = 8000 N. The occupants will also feel they weigh twice as much. This is centripetal force and 'radial g'; it applies whether the aircraft is changing direction in the horizontal plane, the vertical plane or anything between. You may also come across mention of 'negative g'. It is conventional to describe g as positive when the lift produced is in the normal direction relative to the aircraft. When the lift direction is reversed, it is described as negative g. Reduced g and negative g can occur momentarily in turbulence. An aircraft experiencing a sustained 1g negative loading is flying in equilibrium, but upside down. It is also possible for some high-powered aerobatic aircraft to fly an 'outside' loop; i.e. the pilot's head is on the outside of the loop rather than the inside, and the aircraft (and its very uncomfortable occupants), will be experiencing various negative g values all the way around the manoeuvre. It can be a little misleading when using terms such as 2g. For instance, let's say that a lightly loaded Jabiru has a mass of 340 kg, and if you again do the preceding centripetal force calculation in a 45° banked turn using 340 kg mass you will find that the centripetal acceleration is 10 m/s², centripetal force is 3400 N, weight is 3400 N and total lift = 4800 N. The total lifting force is 15% less than in the 400 kg mass calculation but it is still a 1.41g turn; i.e. the ratio 4800/3400 = 1.41. Rather than thinking in terms of ratios, it may be appropriate to consider the actual loads being applied to the aircraft structures. The norm is to use the lift load produced by the wing as a primary structural load reference. In the 400 kg mass calculation the load produced is 5660/8 = 707 N/m², compared to the 500 N/m² load in normal cruise. However, even if the total weight of the aircraft changes, the forces experienced individual structural items — the engine mountings for example — will vary according to the g force produced by the wings. Increasing the lift force in a turn You might wonder how does the Jabiru increase the lift (or more correctly, the aerodynamic force) if it maintains the same cruise speed in the level turn? Well, the only value in the equation — lift = CL × ½rV² × S — that can then be changed is the lift coefficient. This must be increased by the pilot increasing the angle of attack. (Conversely if CL — the angle of attack — is increased during a constant speed manoeuvre the lift — and consequently the aerodynamic load factor — must increase.) Increasing aoa will also increase induced drag, so that the pilot must also increase thrust to maintain the same airspeed. Thus, the maximum rate of turn for an aircraft will also be limited by the amount of additional power available to overcome induced drag. The radius of turn = V²/g tan ø metres. For a level turn, the slowest possible speed and the steepest possible bank angle will provide both the smallest radius and the fastest rate of turn. However there are several limitations: When the steepest bank angle and slowest speed is applied the necessary centripetal force for the turn is provided by the extra aerodynamic force gained by increasing the angle of attack ( or CL ) to a very high value. Also due to the lower airspeed a larger portion of the total lift is provided by CL rather than V². Consequently the induced drag will increase substantially — requiring increased thrust power and there will be a bank angle beyond which the engine/propeller will not be able to supply sufficient thrust to maintain the required lift, and thus height in the turn. All aircraft that are not certificated under the utility or aerobatic categories are limited to bank angles not exceeding 60°. A bank angle of 75° in a level turn would induce a 3.8g load factor — the load limit for a normal category certification. Similarly a level turn bank angle of 77° would induce the 4.4g load limit for an utility category aircraft. The stall speed increases with bank angle, or more correctly with load factor, thus the lowest possible flight speed increases as bank in a level turn increases. Turns at high bank angles, near the accelerated stall speed, with maximum power applied, leaves the aircraft with nothing in reserve. Any mishandling or turbulence may result in a violent wing and nose drop with substantial loss of height. (For more information on turn physics see 'Turning back — procedure and dynamics'.) If you consider an aerobatic aircraft weighing 10 000 N and making a turn in the vertical plane —such as a loop — and imagine that the centripetal acceleration is 2g; what will be the load factor at various points of the turn? Actually, the centripetal acceleration varies all the way around because the airspeed and radius must vary. For simplicity we will ignore this and say that it is 2g all around. If the acceleration is 2g then the centripetal force must be 20 000 N all the way around. A turn in the vertical plane differs from a horizontal turn in that, at both sides of the loop, the wings do not have to provide any lift component to counter weight, only lift for the centripetal force — so the total load at those points is 20 000 N or 2g. At the top, with the aircraft inverted, the weight is directed towards the centre of the turn and provides 10 000 N of the centripetal force while the wings need to provide only 10 000 N. Thus, the total load is only 10 000 N or 1g, whereas at the bottom of a continuing turn the wings provide all the centripetal force plus counter the weight — so the load there is 30 000 N or 3g. This highlights an important point: when acceleration loads are reinforced by the acceleration of gravity, the total load can be very high. If you have difficulty in conceiving the centripetal force loading on the wings, think about it in terms of the reaction momentum, centrifugal force which, from within the aircraft, is seen as a force pushing the vehicle and its occupants to the outside of the turn and the lift (centripetal force) is counteracting it. Centrifugal force is always expressed as g multiples. Wing loading — W/S The term 'wing loading' has three connotations. The prime connotation is the standard expression — design W/S (usually just 'W/S', pronounced 'w-over-s') — which is the ratio of the aircraft designer's maximum allowable take-off weight [W] to the gross wing area . (There are some complications when national regulations specify a maximum allowable weight for an aircraft category that is lower than the design weight of a particular aircraft type; see the 'Weight and balance' module.) Aircraft with low W/S have lower stall speeds than aircraft with higher W/S — so consequently have shorter take-off and landing distances. High W/S aircraft are less affected by atmospheric turbulence. W/S is expressed in pounds per square foot [psf] or kilograms per square metre [kg/m²]. The second wing loading connotation is as the operating wing loading; if the aircraft takes off at a gross weight lower than the designer's maximum, then the operating wing loading — in level unaccelerated flight — will also be lower than the design W/S, as will its stall speed. The third is the load applied by the pilot in manoeuvring flight. As we saw above, pulling 2g in a steep turn will produce a manoeuvring wing loading that is double the operating wing loading. So, if a pilot takes off in an overloaded aircraft (i.e. the aircraft's weight exceeds the design MTOW) and conducts a 2g steep turn, then that manoeuvring wing loading will be greater than the designer's expectations. 3.2.5 Limiting loads and ultimate loads Manoeuvring loads and gust induced loads To receive type certification the design of a general or recreational aviation factory-built aircraft must conform to certain airworthiness standards among which the in-flight manoeuvring loads and the loads induced by atmospheric turbulence, that the structure must be able to withstand, are specified. The turbulence loads are called the gust-induced loads. The U.S. Federal airworthiness standards FAR Part 23 are the recognised world standards for light aircraft certification and the following are extracts [emphasis added]: Three seconds is not much time, so any inflight excursion above the ultimate load will probably result in rapid structural failure. The safety factor of 1.5 applies to fairly new aircraft in good condition; as very light aircraft age aerodynamic stresses, corrosion, hard landings and inadequate maintenance contribute to reduction of that safety factor. Airworthiness certification categories Light aeroplanes can be certificated in one or more of four airworthiness categories — 'normal', 'utility', 'acrobatic' and 'light sport aircraft' (LSA). The minimum positive limit flight load factor that an aircraft in the normal certification category (at maximum gross weight) must be designed to withstand is 3.8g positive. The LSA category minimum positive limit load is 4g. The negative limit flight load factor is –1.5g for the normal category and –2g for the LSA category. Recreational aviation aeroplanes, which are limited to banked turns not exceeding 60°, generally fit into either the normal category or the LSA category. The ultimate loads for the normal category are +5.7g and –2.25g and, for the LSA category, +6g and –4g. Amateur builders should aim to meet the same minimum values for limiting load and ultimate load factors. The 'utility' category (which includes training aircraft with spin certification) limit loads are +4.4g and –2.2g while the 'acrobatic' category (i.e. aircraft designed to perform aerobatics) limit loads are +6g and –3g. Sailplanes and powered sailplanes are generally certificated in the utility or acrobatic categories of the European Joint Airworthiness Requirements JAR-22, which is the world standard for sailplanes; aerobatic sailplanes have limit loads of +7g and -5g. The 'flight load factor' calculation is defined as the component of the aerodynamic force acting normal (i.e. at right angles) to the aircraft's longitudinal axis, divided by the aircraft weight. A positive load factor is one in which the force acts upward, with respect to the aircraft; a negative load factor acts downward. The inflight load factor is a function of wing loading, dynamic pressure and the aoa, i.e. lift coefficient, but see the flight envelope. It should not be thought that aircraft structures are significantly weaker in the negative g direction. The normal level flight load is +1g so with a +3.8g limit then an additional positive 2.8g acceleration can be applied while with a –1.5g limit an additional negative 2.5g acceleration can be applied. The manufacturer of a particular aircraft type may opt to have the aircraft certificated within more than one category, in which case there will be different maximum take-off weights and centre of gravity limitations for each operational category. See weight/cg position limitations. The sustainable load factors only relate to a new factory-built aircraft. The repairs, ageing and poor maintenance that any aircraft has been exposed to since leaving the factory may decrease the strength of individual structural members considerably. Read the current airworthiness notices issued by the RA-Aus technical manager. 3.2.6 Conserving aircraft energy Energy available An aircraft in straight and level flight has: linear momentum — m × v [kg·m/s] kinetic energy (the energy of a body due to its motion) — ½mv² [joules or newton metres (N·m)]; remembering that 'm' in the ½mv² term represents mass (Note: normally, the newton metre — the SI unit of moment of force — is not used as the measure of work or energy; however throughout this guide, it is more helpful to express the kinetic energy in the N·m form rather than joules — the N·m and the joule are dimensionally equivalent) gravitational potential energy — in this case, the product of weight in newtons and height gained in metres chemical potential energy in the form of fuel in the tanks air resistance that dissipates some kinetic energy as heat or atmospheric turbulence. To simplify the text from here on, we will refer to 'gravitational potential energy' as potential energy and 'chemical potential energy' as chemical energy. We can calculate the energy available to the Jabiru cruising: • at a height of 6500 feet (2000 m) • and (air distance flown over time)= 97 knots (50 m/s) • with mass = 400 kg, thus weight = 4000 N • fuel = 50 litres. Then: • potential energy = weight × height = 4000 × 2000 = 8 million N·m • kinetic energy = ½mv² = ½ × 400 × 50 × 50 = 500 000 N·m • momentum = mass × v = 400 × 50 = 20 000 kg·m/s • chemical energy = 50 litres @ 7.5 million joules = 375 million joules. Because it is the accumulation of the work done to raise the aircraft 6500 feet, the potential energy is 16 times the kinetic energy, and is obviously an asset that you don't want to dissipate. It is equivalent to 2% of your fuel. It is always wise to balance a shortage of potential energy with an excess of kinetic energy, and vice versa. For example, if you don't have much height then have some extra speed up your sleeve for manoeuvring or to provide extra time for action in case of engine or wind shear problems. Or if kinetic energy is low (because of flying at lower speeds than normal) make sure you have ample height or, if approaching to land, hold height for as long as possible. The only time to be 'low and slow' is when you are about to touch down. However, during take-off it is not possible to have an excess of either potential or kinetic energy; thus, take-off is the most critical phase of flight, closely followed by the go-around following an aborted landing approach. Ensure that a safe climb speed is achieved as quickly as possible after becoming airborne — or commencing a go-around — and before the climb-out is actually commenced; see take-off procedure. Kinetic energy measurement Kinetic energy is a scalar quantity equal to ½mv² joules if the aircraft is not turning. The velocity must be measured in relation to some frame of reference, and when we discuss in-flight energy management, the aircraft velocity chosen is that which is relative to the air; i.e. the true airspeed. For a landborne (or about to be landborne) aircraft we are generally concerned with either the work to be done to get the aircraft airborne or the (impact) energy involved in bringing the aircraft to a halt. So, the velocity used is that which is relative to the ground. Ground speed represents the horizontal component of that velocity, and rate of climb/sink represents the vertical component. Kinetic energy, gravitational potential energy and energy conservation are complex subjects. If you wish to go further, google the search terms 'kinetic energy' and 'reference frame'. Momentum conversion Let's look at momentum conversion. Consider the Jabiru, weighing 4000 N and cruising at 97 knots (50 m/s) and the pilot decides to reduce the cruise speed to 88 knots (45 m/s). This could be accomplished by reducing thrust — below that needed for 88 knots — allowing drag to dissipate the excess kinetic energy then increasing power for 88 knots. However, if traffic conditions allow, the excess kinetic energy can be converted to potential energy by reducing power, but only to that needed to maintain 88 knots cruise, and at the same time pulling up — thus reducing airspeed but still utilising momentum — then pushing over into level flight just before the 88 knot airspeed is acquired. How much height would be gained? Consider this: • kinetic energy at 97 knots = ½mv² = ½ × 400 × 50 × 50 = 500 000 N·m • kinetic energy at 88 knots = ½mv² = ½ × 400 × 45 × 45 = 405 000 N·m • kinetic energy available = 95 000 N·m • but potential energy [N·m] = weight × height • thus height (gained) = energy available divided by weight • = 95 000 N·m / 4000 N = 24 metres = 78 feet, or 9 feet gained per knot of speed converted. If we recalculate the preceding figures — doubling the initial (100 m/s) and final velocities (90 m/s) — the height gained will increase fourfold to 96 metres, or about 18 feet per knot. Conversely, if we halve the initial velocity to about 50 knots, the height gained per knot converted is halved, to about 4 feet. Note that as mass appears in both the kinetic energy and the weight expressions, it can be ignored; thus the figures are the same for any mass. Sometimes momentum (mass × velocity) is confused with inertia (a particular quality of mass). You will come across the expression 'low inertia / high drag' applied to some recreational light aircraft. This means that although all recreational light aircraft are low-inertia aircraft, compared to other recreational light aircraft this minimum aircraft has a relatively low inertial mass combined with a relatively high parasite drag profile; thus if the thrust is reduced or fails, the drag reduces the airspeed very rapidly. This is exacerbated if the aircraft is climbing. An aluminium tube and sailcloth aircraft at one end of the spectrum may be termed 'low momentum' or 'draggy', while an epoxy composite aircraft at the other end may be termed 'slippery'; some are very slippery indeed. The standing world speed record for an aircraft under 300 kg is 213 miles per hour; that amateur-designed and amateur-built aircraft was powered by only a 65 hp two-stroke Rotax. The handling characteristics for a low inertia/low drag aircraft differ considerably from those of a low inertia/high drag (low momentum) aircraft. Abridged trigonometrical table Relationship between an angle within a right angle triangle and the sides: Tangent of angle=opposite side/adjacent Sine of angle=opposite/hypotenuse Cosine of angle=adjacent/hypotenuse Degrees Sine Cosine Tangent Degrees Sine Cosine Tangent 1 0.017 0.999 0.017 50 0.766 0.643 1.192 5 0.087 0.996 0.087 55 0.819 0.574 1.428 10 0.173 0.985 0.176 60 0.866 0.500 1.732 15 0.259 0.966 0.268 65 0.910 0.423 2.145 20 0.342 0.939 0.364 70 0.939 0.342 2.747 30 0.500 0.866 0.577 75 0.966 0.259 3.732 40 0.643 0.766 0.839 80 0.985 0.173 5.672 45 0.707 0.707 1.000 90 1.000 0 infinity Things that are handy to know Rated power is the brake horsepower delivered at the propeller shaft of a direct drive engine, operating at maximum design rpm and best power fuel/air mixture, in standard sea-level air density conditions. (In a regulatory sense the definition is a little more complex.) An engine is only operated at its rated capacity for short periods during flight, usually during take-off and the initial climb. Rated power for small aero-engines is usually expressed as brake horsepower rather than the SI unit of kilowatts. Further discussion is provided in the 'Engine and propeller performance' module. To convert horsepower to watts multiply by 745.7; or to calculate kilowatts, multiply by 0.75. Design W/S is usually between 11 and 22 psf for GA aircraft, and 4 and 12 psf for ultralights. Gross wing area includes a notional extension of each monoplane wing up to the fuselage centreline but excludes any fairings at the wing/fuselage junction. For multi-engined aircraft, with the engines enclosed in wing nacelles, the wing area would also include the area occupied by the nacelles. Stuff you don't need to know High-performance military aircraft can achieve an aoa exceeding 45°. Aerobatic pilots — and combat pilots — use a value termed specific energy, E or energy height, He. It is the potential energy plus the kinetic energy per kg of aircraft weight; i.e. He = mgh/W + ½mv²/W As W = mg, then the equation can be re-arranged as He = h + V²/2g where h = height. What it expresses is the height that could be achieved if all kinetic energy were transferred to potential energy, but it is of little interest to recreational aviation. The thermal energy content of one litre of avgas is 30 million joules. With good engine handling by the pilot, that litre can provide 10 million joules of mechanical energy to the propeller shaft of most engines. The propeller of the Jabiru is maybe 70% efficient at cruise speed and provides 7.0 million joules, or N·m, of energy from the litre of fuel. Roughly how far will that take the Jabiru cruising at 97 knots? Easy! Drag is 540 N, so 7 000 000 / 540 = 12 965 m or 7.0 air nautical miles. We specify air nautical miles because wind will affect the distance travelled over the ground. STRICT COPYRIGHT JOHN BRANDON AND RECREATIONAL FLYING (.com)
 -
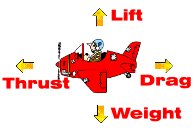 3.1.1 Introduction The four forces When a well-trimmed aircraft is cruising (i.e. flying at a constant speed, and maintaining a constant heading and a constant altitude) in non-turbulent air, there are two sets, or couples, of basic forces acting on it. The two forces in each couple are equal and approximately opposite to each other otherwise the aircraft would not continue to fly straight and level at a constant speed; i.e. the aircraft is in a state of equilibrium where all forces balance each other out so there is no change in its motion. The couple that acts vertically is the lift, generated by the energy of the airflow past the wings and acting upward, and the weight acting downward. So, being equal and approximately opposite, the lifting force being generated must exactly match the total weight of the aircraft. The couple that acts horizontally is the thrust, generated by the engine-driven propeller, and the air resistance, caused by the friction and pressure of the airflow, or drag, trying to slow the moving aircraft. The thrust, acting forward along the flight path, exactly equals the drag. The thrust provides energy to the aircraft and the drag dissipates that same energy into the atmosphere. The forces are not all equal to each other. In fact, an aircraft in cruising flight might generate ten times more lift than thrust. When all forces are in equilibrium a moving aircraft will tend to keep moving along the same flight path at the same speed — whether it is flying straight and level, descending or climbing — until an applied force or a displacement force changes that state of motion. For instance, if the pilot opens the engine throttle fully, and maintains level flight, the thrust force is initially greater than drag and the aircraft accelerates. However, as the speed of airflow over the aircraft increases, the air resistance also increases and the aircraft will soon reach the speed — its maximum — where the forces are again balanced. Inertia, momentum and energy This property of resisting any change in motion, or continuing in the same state of motion or state of rest, is inertia. The mass of a body is a measure of its inertia; i.e. its resistance to being accelerated by an applied force increases with mass. The unit of mass we will be using is the kilogram [kg]. Some older texts refer to the 'slug', which is the unit of mass in the old British gravitational system of measurement units and equals 32.174 lb. A slug accelerates by one foot per second per second when a force of one pound-force is applied to it. Air also has mass and thus inertia, and will resist being pushed aside by the passage of an aircraft. That resistance will be felt both as drag and as pressure changes on the aircraft surfaces. A moving aircraft has momentum, which is mass × velocity and is a measure of the effort needed to stop it moving. (Momentum and inertia are not synonymous). The same aircraft also has the energy of motion — kinetic energy — which is related to mass × velocity squared. Also, because it has climbed above the Earth's surface, it has acquired additional gravitational potential energy which, in this case, is weight × height gained. Energy is discussed further in the section on conserving energy in the next module. An aircraft in flight is 'airborne' and its velocity is relative to the surrounding air, not the Earth's surface. (A ground-based observer sees the aircraft movement resulting from the sum of aircraft velocity and the ambient air velocity — horizontal motion [the wind] plus vertical motion [updrafts, downdrafts and wave action].) However, when the aircraft encounters a sudden change in the ambient air velocity — a gust — inertia comes into play and momentarily maintains the aircraft velocity relative to the Earth or, more correctly, relative to space. This momentarily changes airspeed and imparts other forces to the aircraft. (The fact that inertia over-rides the physics of aerodynamics is sometimes a cause of confusion.) A more massive (heavier) aircraft has more inertia than a less massive (lighter) one, so is more resistant to random displacement forces — wind shear and turbulence. Ultralights — whose mass is less than 750 kg — are all regarded as 'low inertia' aircraft and particularly affected by acceleration loads produced by turbulence. Freedoms of movement If the aircraft's control system allows, it can rotate about each of three axes — longitudinal, lateral and normal (or vertical) — and move forward along the longitudinal axis. An aerobatic aircraft can also move backward along the longitudinal axis — in a tail slide. Rotation about the longitudinal axis is roll, about the lateral axis is pitch — as in a ship pitching in a heavy sea — and about the normal axis is yaw — again, like much in aviation, a nautical term. Other movements can include a bodily movement along the lateral axis (sideslipping, slipping or skidding) or the normal axis (rising or sinking). Thus, an aircraft has six degrees of freedom of movement — three rotational and three translational. The three axes are relevant to the aircraft and each other (not to the horizon) so that when an aircraft is steeply banked its normal axis is closer to horizontal, rather than vertical to the Earth's surface. The axes are orthogonal (at right angles to each other) and, by convention, all are represented as passing through the aircraft's centre of gravity. When manoeuvring, an aircraft may experience any combination of the rotational and translational movements; for example, it may be rolling, pitching, yawing, slipping and sinking all at the same time. Direction of forces relative to the flight path When an aircraft is in straight and level flight lift acts vertically upward with thrust and drag acting horizontally. In fact, lift acts perpendicular to both the flight path and the lateral axis of the aircraft, drag acts parallel to the flight path, and thrust usually acts parallel to the longitudinal axis of the aircraft. So if you imagine an aircraft doing a loop, as in the diagram below, you can see that at one point, when it is going up, thrust will be acting vertically upward, drag vertically downward and lift acting horizontally towards the centre of the loop. At a point on the other side of the loop the thrust acts downward, drag upward and lift again horizontally. Weight, of course, always acts from the centre of mass of the aircraft towards the centre of mass of the Earth, so on the downside of the loop, weight and thrust are acting together and the aircraft will accelerate rapidly unless thrust is reduced. You might ask yourself this: if the aircraft is using its maximum thrust when it starts the loop, how can it climb vertically when lift no longer counters weight, and there is no extra thrust available to also counter the drag plus the weight, which are both now acting downwards? The answer is extra momentum which enables the aircraft to accomplish a fast pull-up, and usually provided by the pilot, of a lower-powered aircraft, accelerating the aircraft in a shallow dive before beginning the manoeuvre. The lift only matches the weight when the aircraft is flying straight and level. When the aircraft is in a steady descent or in a steady climb the lift is a bit less than the weight. We will explore this in the climb/descent modules but just be aware that when the line of thrust is inclined above the horizon the thrust will have a vertical component; i.e. it will provide a lifting force. When the aircraft is turning in the horizontal plane or in the vertical plane as in the loop, or anywhere in between, the lift is greater than the weight. In high-performance military aircraft it can be seven or eight times greater, because the lift provides the centripetal force to make the turn. Note: it's not always true that lift and drag act relative to the flight path. Imagine an aircraft flying straight and level, which encounters a substantial atmospheric updraught. Due to inertia the aircraft will, for the first milliseconds anyway, maintain its flight path relative to the Earth. During that time the 'effective airflow' passing by the wings will no longer be directly aligned with the flight path but will have acquired a vertical component. The lift will now act at 90° to this new 'effective airflow' rather than the actual flight path, and have a significant effect. Also, the wing itself modifies the effective airflow so just for now, until we look at aerofoils and wings, it is simpler to ignore the 'effective airflow' and other concepts and stay with the flight path. 3.1.2 Vector quantities Velocities and accelerations Vector quantities have both magnitude and direction. Velocity is a vector quantity having both a magnitude (the airspeed) and a 3-dimensional direction. A force has both a direction in which it is pushing or pulling and a magnitude (in newtons [N]), thus it is a vector quantity. Momentum, having mass and velocity, is also a vector quantity, but inertia is not. Ignoring weight and friction for now; when only one force is applied to a stationary object, the object will accelerate in the same direction as the force applied. Acceleration is the rate of change of velocity, the change being either in speed or three-dimensional direction, or both. If an aircraft accelerates in a straight line from an airspeed of 25 metres/second [m/s] to 75 m/s in 10 seconds then the average change in airspeed per second is 75 –25 / 10 = 5 m/s, thus the acceleration is 5 metres per second per second [5 m/s²]. The common usage term 'deceleration', referring to a reduction in linear speed only, is generally not used in physics as, in that science, 'acceleration' has both positive and negative connotations. Resultant forces When more than one force is being applied to an object there will be a resultant force, probably imparting an initial acceleration until all forces are again balanced at a new velocity. It is common practice to estimate resultant forces non-mathematically by drawing scaled, arrowed lines to represent each vector quantity, producing the resultant of two vector quantities in a vector parallelogram. The lengths of the lines represent the magnitude of each force and the placements indicate the application points and directions. The diagram is an exaggerated representation of an unpowered aircraft in a constant rate descent, showing that the lift/drag resultant is equal and opposite to the weight vector. In the diagram the resultant shown is the net aggregation of the aerodynamic forces generated by the wings, and it is conventional to then resolve that into its lift and drag components. We will be looking at aerodynamic forces in later modules. 3.1.3 Weight Weight as a body force There is a common, if not universal, tendency to equate the mass of a body with its weight. This is not surprising, as both are usually expressed using the same unit — kilograms [kg]. You need to appreciate that weight is a 'body force', the product of the body mass and the acceleration due to gravity. The force due to gravity — or weight — of an aircraft on the ground or in flight is expressed as W = m × g, where — somewhat confusingly — m is the symbol for mass (rather than metres) and g is a gravity constant applied to objects on, or near, the Earth's surface. That constant is not a force but an acceleration of 9.806 m/s² — also known as the acceleration of free fall. In coming calculations we will use the performance of an early version of the Australian designed Jabiru aircraft as representative of the general aviation/ultralight four cylinder, two-seat, fixed-pitch and fixed-undercarriage recreational aircraft. All forces, including weight, are measured in newtons. The maximum allowed take-off weight [MTOW], of the Jabiru of mass 430 kg sitting on the runway is m = 430 × g= 9.806 = 4216 N. The Jabiru with an 80 kg pilot on board and with half the maximum fuel load would have a mass of only 340 kg which makes some difference to performance. We shall explore this in other modules. To simplify calculations, we will load full fuel, plus a lightweight passenger, into the Jabiru giving it a loaded mass of 400 kg and use g=10 m/s², thus weight = 4000 N. Centre of gravity The position of the centre of mass or centre of gravity [cg] within the aircraft will vary according to the seating of passengers and stowage of luggage. The knowledge of the total mass of the loaded aircraft and the cg position — the weight and balance — is very important, as we will see in the 'Weight and balance' module. Weight is always presumed to act from the cg position to the centre of the Earth. We will also see, in the 'Altitude and altimeters' module, that atmospheric conditions affect aircraft performance, and subsequently the appropriate MTOW. Vector quantities are sometimes very easy to calculate; for example if a Jabiru, weighing 4000 N, is cruising straight and level, then the lift force must be 4000 N pushing vertically upward. 3.1.4 Lift The lift equation When an aircraft is cruising in straight and level flight, at low altitudes, the wings are set at a small angle — 3 to 5° — to the 'flight path' (or the 'line of flight' or the 'effective airflow' or the 'free stream airflow' or the 'relative wind', all of which mean much the same thing in cruising flight in a non-turbulent atmosphere). The net sum of the aerodynamic reaction on the wing is a resultant force directed upwards and backwards. Aerodynamicists have found it convenient to resolve that resultant force into just two components: that part acting backward along the flight path is the wing drag, and that acting perpendicular to the flight path is the lift. The amount of lift, and drag, generated by the wings depends chiefly on: (a) the angle at which the wing meet the airflow or flight path — the angle of attack (b) the shape of the wing, particularly in cross-section — the aerofoil (c) the density (i.e. mass per unit volume) of the air (d) the speed of the free stream airflow; i.e. the airspeed (e) and the wing plan-form surface area. There is a standard equation to calculate lift from the wings, which will be often referred to in these notes: (Equation #1.1) Lift [newtons] = CL × ½rV² × S The expression ½rV² (pronounced half roe vee squared) represents the dynamic pressure of the airflow in newtons per square metre [N/m²]. (Please note — if a 'Symbolic' font is not available, your browser will not display the Greek letter rho, the accepted symbol for air density, and may display r or ? instead.) The dynamic pressure expression, ½rV², is very similar to the kinetic energy expression ½mv², where m = mass. Air density is mass per unit volume; i.e. kg/m³, so the dynamic pressure of the airflow is the kinetic energy per unit volume. The values in the expression are: r (the Greek letter rho) is the density of the air, item (c), in kg/m³ V² is the airspeed, item (d), in m/s S is the wing area, item (e), in m² CL (C sub L) is a dimensionless quantity — the lift coefficient — which relates mostly to item (a), but also to item (b). In normal operations for very light aircraft, and when there are no high lift devices incorporated in the wing structure, CL usually has a value between 0.1 and 1.5. It can be regarded as the ratio of the conversion of dynamic pressure into lift, by the wing, at varying angles of attack. Angle of attack and the lift coefficient Item (a) above, the angle at which the wings meet the flight path — more properly termed the geometric angle of attack — is near 16° at minimum controllable airspeed and around 2 to 5° when cruising at low altitudes; less at higher speeds, greater at higher altitudes. We will cover the close relationship between CL, angle of attack (aoa or alpha) and airspeed in the aerofoils and wings module. The diagram shows a typical CL vs angle of attack curve for a light aircraft not equipped with flaps or high-lift devices. From it you can read the CL value for each aoa, for example at 10° the ratio for conversion of dynamic pressure to lift is about 1.0. Note that CL still has a positive value (about 0.1) even when the aoa is –1°. This is because of the higher camber in the upper half of the wing; some highly cambered wings may still have a positive CL value when the aoa is as low as –4°. A light non-aerobatic aircraft pilot would not normally utilise negative aoa because it involves operating the aircraft in a high-speed descent, but we will discuss this further in the 'Flight at excessive speed' module. Also note that the lift coefficient increases in direct relationship to the increase in angle of attack, until near 16° aoa where CL reaches its maximum and then decreases rapidly as aoa passes that critical angle. A rule of thumb for light aircraft with simple wings is that each 1° aoa change — starting from –2° and continuing to about 14° — equates to a 0.1 CL change. Also, it is not just the wings that produce lift. Parts of a well-designed fuselage — the aircraft body — can also produce lift and the vertical component of the thrust vector can supplement lift when that vector is angled upwards. We can calculate CL for the Jabiru cruising at an altitude of 6500 feet and an airspeed of 97 knots (50 m/s). The wing area is very close to 8 m²: • lift = weight = 4000 N • r = 1.0 kg/m³ (the approximate density of air at 6500 feet altitude) • V² = 50 × 50= 2500 m/s • S = 8 m² Lift = CL × ½rV² × S Dynamic pressure = ½ ×1.0 × 2500 = 1250 N/m² So, 4000 = CL × 1250 × 8, — thus — CL = 0.4. Changing the angle of attack Now what happens if the pilot decides to decrease airspeed to 88 knots (45 m/s) while maintaining the same altitude? First, the pilot decreases power to give 88 knots then adjusts control pressure to maintain the same altitude — but look at the changes in the lift equation. • lift still equals weight = 4000 N • air density still = 1.0 kg/m³ • V² changes and is now = 45 × 45 = 2025 m/s • S can't change = 8 m² Dynamic pressure = ½×1.0 × 2025 = 1012.5 N/m² So, 4000 = CL × 1012.5 × 8, — and — CL = 0.5 approximately. So, the result of decreasing airspeed, while maintaining straight and level flight, is an increase in the lift coefficient from 0.4 to 0.5. That has two possible contributors — the shape of the aerofoil and the angle of attack; items (a) and (b) above. Because the pilot can't change the aerofoil shape (unless flaps are extended, which we discuss in the 'Aerofoils and wings' module) the angle of attack must have changed. How? By the pilot adjusting control pressure to apply an aerodynamic force to the aircraft's tailplane (or some other control surface), which has the effect of rotating the aircraft just a degree or so about its lateral axis. Once the pilot has achieved the desired aoa, as indicated by the new airspeed (which will be explained in the 'Airspeed' module), the tailplane trim control is adjusted and the aircraft will then maintain that aoa. It may be appropriate to slip in another slight complication at this point. Lift, like weight, may be taken as acting through a central point — the centre of pressure [cp]. The position of the cp changes with aoa and this movement has a significant effect — it causes the nose of the aircraft to pitch up or down. So, the lift and weight are usually not in equilibrium and the rotational moment must be counteracted by aerodynamic forces produced by the horizontal stabiliser. Other tailplane surfaces also produce aerodynamic forces for trim and control, so to maintain an aircraft in straight and level flight — apart from the four forces mentioned — there will always be another force, or forces, generated by the fixed tailplane of most aeroplanes or its movable surfaces. We will look at this in the 'Stability' module. 3.1.5 Thrust Action and reaction In the Jabiru the engine supplies torque directly to the propeller shaft and the propeller converts the torque to thrust; we will amplify how this is accomplished in the 'Engine and propeller performance' module. The propeller pushes backwards a tube of air with the same diameter as itself; i.e. it adds momentum to the tube of air where momentum = mass × velocity, and is also a vector quantity. Increasing the speed also imparts kinetic energy to the air. This tube of accelerated, energised air is the slipstream. Considering Isaac Newton's third law you expect an equal and opposite reaction to the action of adding momentum. This reaction is the application of forward momentum to the propeller, which pulls the rest of the aircraft along behind if the engine/propeller installation is a 'tractor' type, or pushes it if the engine/propeller installation is a 'pusher' type. The line of thrust We need to clarify the line of thrust. This line is extended forward through the propeller shaft, which is usually aligned with the longitudinal axis of the aircraft, but not always. For instance, the engine and propeller installation in the carrier-borne Hellcat, of Second World War fame, was vertically offset so that the thrust vector was 3° down; consequently, the aircraft flew with a rather jaunty tail-down attitude. I think the reason was that the thrust line then extended back over the cg, making the aircraft more stable at the very low speeds required for deck landing. (You can read a little about the deck landing techniques of those days — my youth — in this magazine article). The relationship of the longitudinal axis with the horizontal flight path — the aircraft's attitude — varies with the speed of the aircraft. At maximum allowable airspeed, or Vne, the longitudinal axis might coincide exactly with the flight path but as speed decreases, the axis starts to angle up and could be inclined 15° to the flight path at minimum controllable airspeed. Because the line of drag is always aligned with the flight path, then the thrust vector does not directly oppose the drag vector. The diagram, slightly exaggerated for clarity, shows the relationship between angle of attack and line of thrust to the flight path, for an aircraft maintaining level flight at a very slow speed. The flight path is horizontal so the drag vector will also be horizontal; i.e. aligned with the relative airflow. The line of thrust is aligned with the longitudinal axis, so the angle between the thrust line and the horizontal flight path is the aircraft attitude — in this case, its attitude in pitch. The wing chord line is extended so that the geometric angle of attack can be seen — the angle between the chord line and the flight path. The lift and weight vectors would both be at right angles to the flight path. You might notice from the diagram that the thrust vector will have quite a substantial vertical component, so that part of the thrust is supplementing lift. Thus we have just destroyed our previous assertion that if an aircraft is flying straight and level, lift must always equal weight. In this instance, the lift is less than weight and the (very small) shortfall is provided by the vertical component of thrust. So it is more correct to say that, if an aircraft is flying straight and level, lift plus the vertical component of thrust must equal weight. We can estimate the thrust delivered by the Jabiru's propeller, cruising at a speed of 97 knots at 6500 feet: From the pilot's operating handbook we find that the engine is rated at 80 hp × 746 = 60 kilowatts [kW], and cruise power for 97 knots is 65%, or 39 kW. The fixed pitch propeller is about 70% efficient at cruising speed so the effective power from the propeller is 27 kW. One watt is the work accomplished by a force of one newton moving an object one metre in one second. The aircraft is moving at 97 knots, or 50 m/s (knots × 0.514 = m/s), so, 27 000 W divided by 50 [m/s] equals 540 N and that is the thrust being provided, which also means the drag is 540 N. Compare that to the weight and lift of 4000 N, stated in section 1.3, and you see that the lift force — silently and efficiently generated simply by the angle of the wings and the velocity of the airflow — is 7.4 times the thrust force — noisily and inefficiently generated by the engine burning expensive fuel. That is being a bit unfair because the wings are really converting much of the thrust into a lifting force. Put another way the lift to drag ratio when cruising at 97 knots is 7.4:1. We will examine lift/drag ratios in the 'Aerofoils and wings' module. The slipstream The slipstream speed of an aircraft at cruising speed might be 20% greater than the aircraft speed, during a climb it could be 50% faster, and when the aircraft is maintaining height near its minimum controllable speed, slipstream velocity might be 100% greater. Some aircraft are designed so that the slipstream over the centre section of the wings increases V and thus lift, and the combination of the vertical component of thrust plus the slipstream effect means that possibly 25% of the thrust output is contributing lift when flying in a tail-down attitude. 3.1.6 Air resistance to motion Induced drag and parasite drag Drag is the resistance of the air to an aircraft pushing through it. The resistance depends on: (a) the streamlining of the aircraft body (b) i. the excrescences attached to the airframe ii. turbulence at the junctions of structural components iii. the cooling airflow around the engine (c) the roughness of the surface skin (d) the 'wetted' area; i.e. the amount of surface exposed to the airflow (e) the density of the air (f) the speed of the airflow (g) the angle of attack. These components of drag are classified in several ways and we will look at them in the 'Aerofoils and wings' module. Part of the air resistance, the induced drag, is a consequence of item (g) the angle of attack. Induced drag is very high, maybe 70% of the total, at the high aoa of the minimum controllable airspeed, but induced drag decreases as speed increases, being possibly less than 10% of the total at full throttle speed. However the balance of the air resistance, known as parasite drag, increases as speed increases until the total air resistance equals the maximum thrust that can be produced. You can see from the diagram that parasite drag is directly proportional to dynamic pressure [½rV²] while induced drag is inversely proportional to it. Thus in normal straight and level flight, air resistance is high at both minimum and maximum airspeeds and lowest at some mid-range speed where — as resistance is at a minimum — the thrust required to maintain constant height will also be at a minimum; consequently, that is the speed — Vbr — which provides maximum range. If drag is at a minimum, then the lift/drag ratio will be at a maximum; consequently, this is very close to the best engine-off glide speed — Vbg. Air density (and thus air resistance) decreases with increasing altitude. So, the parasite drag component for a given airspeed decreases with increasing altitude while the induced drag component increases, because the wing has to fly at a greater aoa to produce the lift required. The standard expression for total aircraft drag is very similar to the lift equation: (Equation #1.2) Total drag [newtons] = CD × ½rV² × S where CD is the total drag coefficient and the ratio of total aircraft drag to dynamic pressure. CD increases as aoa increases. Things that are handy to know The generic term aircraft covers a wide range of airborne vehicles: lighter-than-air (aerostats); e.g. airships and hot-air balloons, and heavier-than-air (aerodynes). The latter includes gliders, powered parachutes, weight-shift controlled trikes or microlights, rotorcraft, helicopters, unmanned aerial vehicles and aeroplanes of all types from high performance supersonic fighters, jump jets or jumbo jets, to those like our friendly single-engine Jabiru. However, for the purpose of these notes we use the term aircraft to refer only to a class of 'general aviation' and 'sport and recreational aviation' aeroplanes with piston-engines driving propellers; relatively simple wing configurations including parawings; minimum power-off controllable airspeeds possibly as low as 20 knots; and possibly a maximum cruise airspeed, for a really high-performance aeroplane in that class, of 250 knots. These aircraft generally have one or two engines rated at 20 hp to 400 hp. The general aviation aircraft have normal wing loadings (i.e. weight/wing area) between 7 and 24 pounds per square foot (35–120 kg/m²) and maximum lift/drag ratios of 9:1 to 12:1, while ultralights have wing loadings between 4 and 12 pounds per square foot (20–60 kg/m²) and aircraft lift/drag ratios of 5:1 to 12:1. A newton [N] is the force required to give a mass of one kilogram an acceleration of one m/s². Isaac Newton's third law: If one body exerts a force on another there is an equal and opposite force — a reaction — exerted on the first body by the second. A knot is a speed of one nautical mile per hour, 0.5144 m/s or roughly 100 feet per minute. One nautical mile is the length, at the Earth's surface, of one minute of arc of a great circle and currently accepted to equal 1852 metres or 6076.115 feet. Stuff you don't need to know • Objects do not fall freely in the Earth's atmosphere. The air resistance (drag) increases as both fall velocity and air density increase until a terminal velocity is reached — where the drag force and the weight (the force due to gravity) are balanced — and the object stops accelerating. If the fall continues the object will start to slow slightly because of increasing air density at lower altitude, which increases drag. A streamlined body will have a higher terminal velocity than a non-streamlined body, of the same mass, because of the lower drag. STRICT COPYRIGHT JOHN BRANDON AND RECREATIONAL FLYING (.com)
 -
Weekly competitions are here...each week some lucky site user will win a product from the Clear Prop Pilot Supplies Shop. You can see what the competition for the week is and how you can win by looking in the Competition Block displayed in some of the side columns on the site. Good luck and let's bring some fun to this great resource
-
I worked for Coles/Myer around 2000 in charge of their GST Implementation Program...I was working out of one of their "Little Shop" areas (if you what they are) in Lonsdale St.
-
This one looks a lot safer than the first one:
-
Videos I have seen of helicopters pulling high tension power cables have done so with the chopper remaining vertical so if the cable snapped and flung back it would just go somewhat horizontal and not into the blades...in this video the chopper is angled over pulling straight thus if the cable snapped it could fling straight into the blades
-

-
Hi Bob, I have just added the link to the video to the opening post
-
Can anyone else see the video????
-
I have posted this here more as a potential Accident and Incident...this is why there are very few Old Bold Pilots...ask yourself what would happen if the cable snapped https://www.facebook.com/watch/?v=1498727836986067
-
-
There is a lesson to be learnt here: https://www.facebook.com/watch/?v=1297030927303359
-
Not sure if you have noticed but thought I would let you know that although you can "Like" a post including an opening post of a thread, but you can also rate a thread overall. At the top right of a thread there is a star rating system that you can use to rate a thread subject out of 5...just click on of the stars that you feel appropriate to rate the thread. Did you know by doing this helps us to know what types of thread topics interest you
-
Well we all know how this year has impacted our lives but what about flying hours? How many hours flying have you done on average in previous years compared to how many hours you have done, or likely to do this year?
-

 A must read for every pilot! The Airplane Flying Handbook provides basic knowledge that is essential for pilots. This handbook introduces basic pilot skills and knowledge that are essential for piloting airplanes. It provides information on transition to other airplanes and the operation of various airplane systems. It is developed by the Flight Standards Service, Airman Testing Standards Branch, in cooperation with various aviation educators and industry. This handbook is developed to assist student pilots learning to fly airplanes. It is also beneficial to pilots who wish to improve their flying proficiency and aeronautical knowledge, those pilots preparing for additional certificates or ratings, and flight instructors engaged in the instruction of both student and certificated pilots. It introduces the future pilot to the realm of flight and provides information and guidance in the performance of procedures and maneuvers required for pilot certification. Topics such as navigation and communication, meteorology, use of flight information publications, regulations, and aeronautical decision making are available in other Federal Aviation Administration (FAA) publications.Occasionally the word "must" or similar language is used where the desired action is deemed critical. The use of suchlanguage is not intended to add to, interpret, or relieve a duty imposed by Title 14 of the Code of Federal Regulations (14CFR).It is essential for persons using this handbook to become familiar with and apply the pertinent parts of 14 CFR and theAeronautical Information Manual (AIM). The AIM is available online at www.faa.gov. The current Flight StandardsService airman training and testing material and learning statements for all airman certificates and ratings can be obtainedfrom www.faa.gov. 2016 Edition book is available for download from the Recreational Flying Downloads section
 -
Version FAA-H-8083-3C
33 downloads
See below for updated versionFree -
 Includes all updates as of 2019! The Advanced Avionics Handbook is a new publication designed to provide general aviation users with comprehensiveinformation on advanced avionics equipment available in technically advanced aircraft. This handbook introduces the pilotto flight operations in aircraft with the latest integrated "glass cockpit" advanced avionics systems.Since the requirements can be updated and the regulations can change, the Federal Aviation Administration (FAA)recommends that you contact your local Flight Standards District Office (FSDO), where FAA personnel can assist youwith questions regarding advanced avionics equipment flight training and/or advanced avionics equipment questions aboutyour aircraft. Available for download in the Recreational Flying Downloads section
 -
Version FAA-H-8083-6
18 downloads
This new FAA handbook (FAA-H-8083-6, Effective 2009) provides general aviation users with comprehensive information on the advanced avionics equipment available in technically advanced aircraft (TAA). VFR and IFR operations in aircraft with the latest integrated “glass cockpit” instrumentation are covered here, helping pilots understand which advanced avionics systems to use and when. Readers will learn the “knob-ology” associated with operating cockpit-computers, including data entry, maintaining current databases, and accessing information from the various screens. Common pilot errors, catching those errors, and instrument failures are discussed, as well as recommendations for using standby instruments during both normal and emergency operations. Each phase of flight is covered, so readers will know how to execute departure, enroute and approach procedures using glass cockpit instrumentation. Subjects covered include the Primary Flight Display (PFD), Multi-Function Display (MFD), moving maps, terrain, cockpit weather, traffic data, fuel management systems, and electronic charts and checklists. Essential skills checklists and summaries conclude each chapter for a comprehensive review and quick-check reference. Chapter 01: Introduction to Advanced Avionics Chapter 02: Electronic Flight Instruments Chapter 03: Navigation Chapter 04: Automated Flight Control Chapter 05: Information Systems Essential Skills Checklist & Glossary You also need to Download the Errata SheetFree -
Parafield Airport - more clowns having a whinge....
Admin replied to Jabiru7252's topic in AUS/NZ General Discussion
-
i have added "CASA Aircraft Register Search" to the Resources: Tools and Calculators section so you can quickly serach for any VH registered aircraft. I will be updating the page soon to also include NZ, US, UK register searches...hope you find it useful. There are many many more calculators and tools that I will be progressively adding to the Resources section that I hope you will find helpful...if you know of any that you may need then please let me know so I can prioritise them for you. Recreational flying (.com) just keeps on getting better so please, let everyone know about this great resource
-
 Australia VH- Keyword search: Serial: Canada C- Beginning With Exact Match Ending With Anywhere Common name: Beginning With Exact Match Ending With Anywhere Model name: Beginning With Exact Match Ending With Anywhere Serial number: Beginning With Exact Match Ending With Anywhere Owner name: Beginning With Exact Match Ending With Anywhere USA N- *Manufacturer name: *Model name: Serial Number: Sorted By: N-Number Manufacturer Name Model Name Name
 -
We have now completed uploading the entire Section 2: Aviation meteorology of John Brandon's Flying Tutorials in the Tutorial section of the site...hope they help
-
2.12 Acquiring aviation weather reports and forecasts
Admin posted a tutorial in Aviation meteorology
 2.12.1 The Bureau of Meteorology's Aviation Weather Service The Australian Government's Bureau of Meteorology (BoM) is required to support civil and military aviation by the provision of aviation weather services in the form of weather observations, forecasts and warning or advisory material. The BoM also supplies selected aviation products to Airservices Australia for their online pilot briefing system — the NAIPS Internet Service [NIS]. The following aviation products can be accessed from the BoM Aviation Weather Services page — select the product category from those listed in the left-hand frame of the page. Aviation forecasts Low-level Area Forecasts [ARFOR] are a coded statement of the general weather situation for the lower levels of the atmosphere (up to 18 500 feet) and the expected conditions for a particular forecast area — the latter as detailed on the PCA or as indicated on the clickable map of Australia. The forecast period is not less than 9 hours or greater than 15 hours. The forecast is available at least one hour before commencement of the validity period. Pilots should regard forecasts as the best possible predictions from professional meteorologists supported with extensive computer modelling. However, meteorologists and computer modelling may not predict local micrometeorological events. Terminal Aerodrome Forecasts [TAF] are a statement of the most likely meteorological conditions expected, for a specified period, in the airspace within the vicinity of the aerodrome. TAFs are issued for about one third of Australian aerodromes, at not less than six hourly intervals, and are usually valid for 12 hours. Most of the weather reports and forecasts are encoded using the World Meteorological Organization/International Civil Aviation Organization international weather code. Area QNH (Terminal) Trend Forecasts [TTF] are only issued for the 20 or so major airports and military bases. TTFs are an aerodrome actual weather report combined with a forecast of changes to conditions during the next three hours. The TTF was introduced to overcome the time-span deficiencies of the TAF. Instructions on how to read the ARFORs, TAFs and METARS are available online at the BoM's 'Knowledge Centre', accessible from the right hand side of the Aviation Weather Services page. The older aviation eHelp section still exists on the BoM website. (If a user name is requested use 'bomw0007' and the password 'aviation'.) You may find other useful material via the 'Educational and reference' box. Aviation observations Aerodrome routine meteorological reports [METARs] are routine observations of weather conditions at an aerodrome issued on the hour or half hour, often through automatic weather stations. SPECI are special reports issued when conditions meet specified criteria. Aerological diagrams and low level wind profiles are useful information for glider pilots. Aviation weather packages Click the 'Charts only' button from the options provided to display all of the following: The latest Australian mean sea level pressure analysis The latest Australian mean sea level pressure forecasts The latest satellite image The aerodrome weather information service [AWIS] Automatic weather stations [AWS] are located at about 190 airfields. All the stations are accessible by telephone and about 70 are also accessible by VHF NAV/COMM radio. The access telephone numbers and the VHF frequencies of the AWS can be found by entering the 'Location information' page and downloading the pdf for the relevant state. For an example of the service from an AWS call 08 8091 5549 to hear the current automatic weather information broadcast at Wilcannia, NSW. 'Plain English' area forecasts, terminal aerodrome forecasts and meteorological observations Ian Boag has produced an excellent, freely available, online, well-tested, plain language meteorological translator [PLMT] available here on Recreational Flying (.com) under Resources , providing current ARFOR, METAR and TAF within all Australian ARFOR areas decoded into 'plain English'. However, pilots must still get the NOTAM from the Airservices site. Bear in mind that CAR 120 imposes penalties for use of forecasts that were not made with the authority of the Director of Meteorology, or by a person approved for the purpose by CASA, and it may be that plain English conversions are not authorised by the Director, but as the original section of code is presented under the decoded text, it is most likely that there is no problem with Ian Boag's excellent facility; it could be conceived as an learning tool for student pilots. Student pilots should be aware that the ability to decode BoM aviation reports and forecasts will be tested in some of the aviation examinations. General weather observations, forecasts and radar images Access to the latest general rather than aviation specific weather observations and forecasts plus satellite imagery (visible and infrared) are obtained via the BoM home page. Weather radar images (precipitation location and intensity), from about 50 weather watch radars, are updated at 10 minute intervals. The images from individual radars cover an area of 256 km radius but may be combined into a larger mosaic. The last four snapshots from each radar can be looped to provide a good indication of current storm development, intensity plus the direction and rate of movement. Lightning tracker websites such as Weatherzone provide useful information on current storm location and movement. 2.12.2 Airservices Australia's NAIPS Internet Service The most convenient way to download the coded ARFOR, TAF and METAR plus the NOTAM is from Airservices Australia's NAIPS Internet Service [NIS], 'a multi-function, computerised, aeronautical information system. It processes and stores meteorological and NOTAM information as well as enabling the provision of briefing products and services to pilots and the Australian Air Traffic Control platform'. NIS is accessed through the internet with any web browser or access may be integrated within flight planning software. The Bureau of Meteorology provides all the weather products to the NIS. You must register with AsA before you can access the NIS. You are required to create a 'user name' and a password. If you don't have an ARN or Pilot Licence Number leave that field blank, don't use your RA-Aus or other sport and recreational organisation membership/Pilot Certificate number, it may conflict with someone's Aviation Reference Number. Download the NIS user manual (1.6 MB). When registered, you can log in; enter user name and password, and then click the required link. If you choose 'Area Briefing' you can select up to five briefing areas by clicking on the map or by entering the required areas in the entry boxes, and then click on the 'Submit Request' button. The ARFOR plus TAFs and METARs and NOTAM for the aerodromes in that area will be presented in the form of a pre-flight briefing. See an actual briefing with explanatory notes added. For further information read the weather check section of the Flight Planning and Navigation Guide. 2.12.3 Acquiring weather information in flight There are several means of obtaining a limited amount of weather information while airborne: AERIS — the Automatic Enroute Information Service network ATIS — the Automatic Terminal Information Service at some aerodromes AWIS — the Aerodrome Weather Information Service at all automatic weather stations can be accessed by telephone and about 70 of them also provide VHF access. FLIGHTWATCH — the on-request service provided by Airservices Australia. For further information read the acquiring weather information section of the VHF Radiocommunications Guide. Inflight weather warning broadcasts by Air Traffic Services SIGMETs report the occurrence or expectation of significant meteorological events such as widespread duststorms, a severe line squall or heavy hail. SIGMETs are issued by the BoM but broadcast by the Air Traffic Service for the affected area as a hazard alert; see AIP GEN section 5.1. AIRMETs report the occurrence or expectation of less severe meteorological events and applies only to aircraft operating below 10 000 feet. AIRMETs are issued by the BoM but broadcast by the Air Traffic Service as a hazard alert for the affected area; see AIP GEN section 5.3. 2.12.4 AIP Book and ERSA Airservices Australia publishes online versions of the AIP Book and ERSA at www.airservicesaustralia.com/publications/aip.asp. You must click the 'I agree' button to gain entry. For further information about the meteorological service reports and forecasts, read the section AIP GEN 3.5 (about 50 pages). To find a particular section of AIP or ERSA you have to click through a number of index pages. The section/sub-section/paragraph numbering system is designed for an amendable loose leaf print document and you may find it a little confusing as an on-line document. STRICT COPYRIGHT JOHN BRANDON AND RECREATIONAL FLYING (.com)